How to Use Probability Playground
Map Page
- Select a distribution to load the page for the distribution.
- Select the link between two distributions to load the details of their relationship.
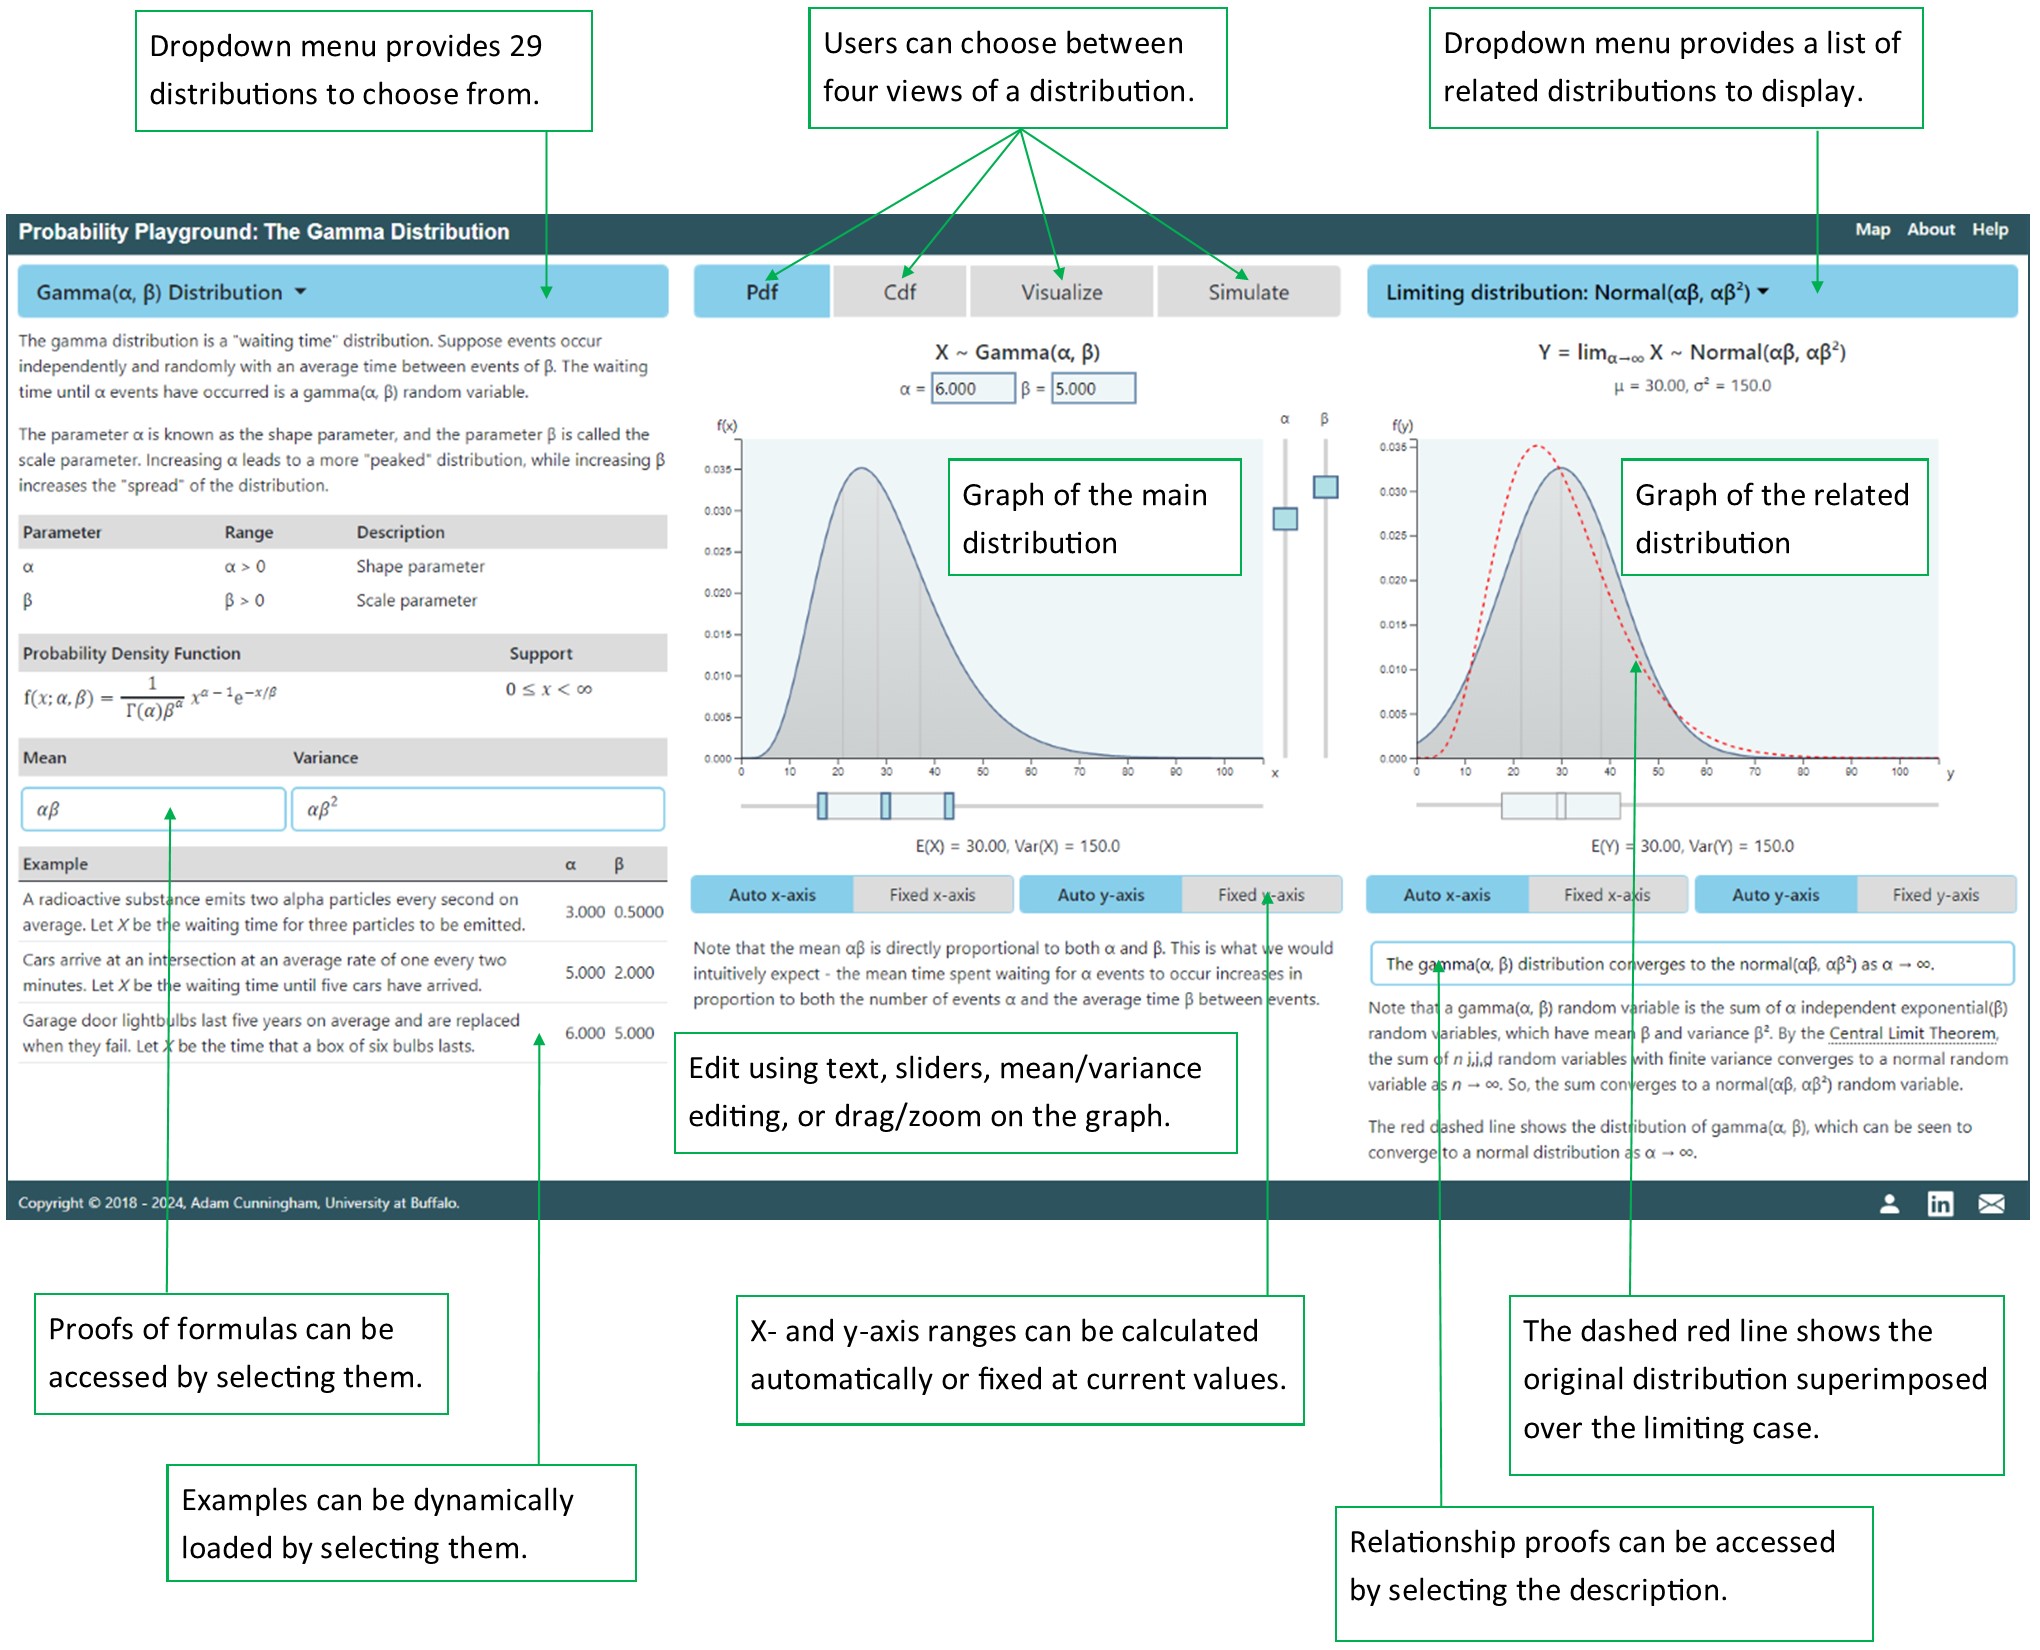
Distribution Pages
- Use the dropdown menu to see all available distributions.
- Select the related distribution to see all distributions that are related to the current one.
- Select an example to load the example.
- Edit the distribution parameters by dragging or using the up/down keys on the vertical sliders to the right of the graph.
- Change the mean by dragging left/right directly on the graph or using the left/right arrow keys.
- Zoom directly on the graph or use the up/down keys to change the variance.
- The space below each graph displays a box centered on the mean with one standard deviation
either side (if the mean and variance are defined).
- For continuous distributions, vertical lines are displayed on the graph to show the first
quartile, median, and third quartile.
Display Options
- Use the buttons above the graph to switch between displaying the probability mass/density function (pmf/pdf), the
cumulative distribution function (cdf), a visualization of the process which generates the distribution, and a simulation of the generating process.
- Use the buttons below the graphs to switch between fixing the axis ranges at their current values and having them chosen automatically.
Related Distributions
- When a related distribution is loaded, the parameters for the related distribution are derived from the current distribution and the link between them.
- Limiting distributions are shown with the same mean (and variance if appropriate) as the distribution they approximate.
- The number of random variables in a sum/product/maximum/minimum can be changed using the slider next to the graph.
- For a sampling distribution, the size of the sample can be changed using the slider next to the graph.
Glossary
- cdf
- Cumulative distribution function
- i.i.d
- Independent and identically distributed
- mgf
- Moment generating function
- pdf
- Probability density function
- pmf
- Probability mass function
- rv
- Random variable