Map Projections Maps are a two-dimensional representation of a three-dimensional world. To make these representations, the cartographer must calculate geographic features so that they are represented as close to real as possible. This is done by "projecting" the geo points onto the flat surface and creating distortions of the original points so that they can be rendered as closely as possible on the map. Map projections are varied and numerous, and are used for specific purposes. Since the Earth is a spheroid, translating the features onto a plane surface requires a certain amount of distortion. This distortion appears as very small near the center of the projection, but becomes more noticeable as the features are plotted further from the center. Because there are so many different needs by map users, there are projections that try to fit those needs as close as possible. Every map projection compromises some element (e.g., distance), in favor of other elements. 
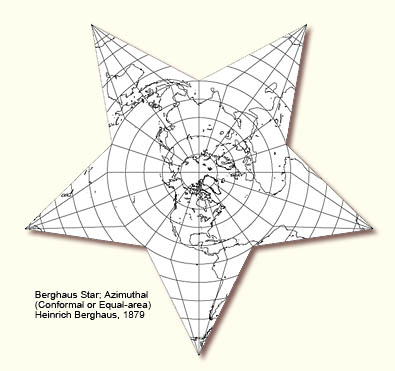
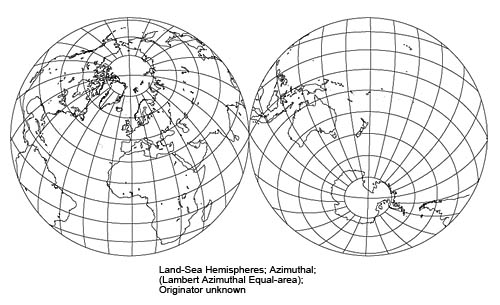
Below are basic examples to show the main types of projections. For a more detailed explanation, with samples, visit the Map Projection Overview by Peter H. Dana (where some of the images below originated), or any of these links. |
![]() |
![]() |
This is a simple illustration of how map projections work. Points on the planet surface are "projected" onto the paper using mathematical formulae. |
![]() |
This example shows how the United States would look if it were mapped using three different projections. |
![]() |
Cylindrical Projections. One of the basic projections is based on the idea that the Earth can be described by expanding the points onto a cylindrical shape. Note that the further away points are from the Equator, the greater the distortion. Examples of some cylindrical projections are: Cylindrical Equal Area, Behrmann Cylindrical Equal-Area , Stereographic Cylindrical, Peters, Mercator, and Transverse Mercator. |
![]() |
Conic Projections. For
maps and charts of a hemisphere (not the complete globe), conic projections
are more reliable and show less distortion. Conic projections are used
mainly for polar maps, and for maps that need to show only a portion
of the globe. Examples of some conic projections are: Albers Equal
Area Conic, Equidistant Conic, Lambert Conformal Conic, and Polyconic
(one of the more common).
|
![]() |
Azimuthal Projections. Azimuthal projections result from projecting a spherical surface onto a plane. When the plane is tangent to the sphere contact is at a single point on the surface of the Earth. Examples are: Azimuthal Equidistant, Lambert Azimuthal Equal Area, Orthographic, and Stereographic (often used for Polar regions). |
![]() |
Other Projections include a variety of specialized or fanciful types. A good site is the Gallery of Map Projections. A nicely arranged, comprehensive set of sample projections. For something really unusual, see the Map Projection Home Page. Several others are below. |
![]() |
![]() |
![]() |
David J. Bertuca, Map Librarian, University at Buffalo. Last Modified:
25 April 2013 The materials selected above do not necessarily reflect the policies and procedures of the State University of New York at Buffalo. |