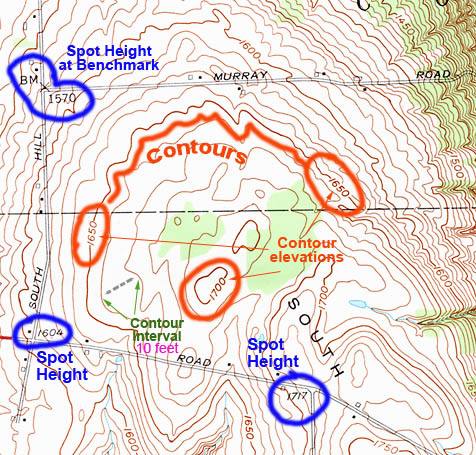
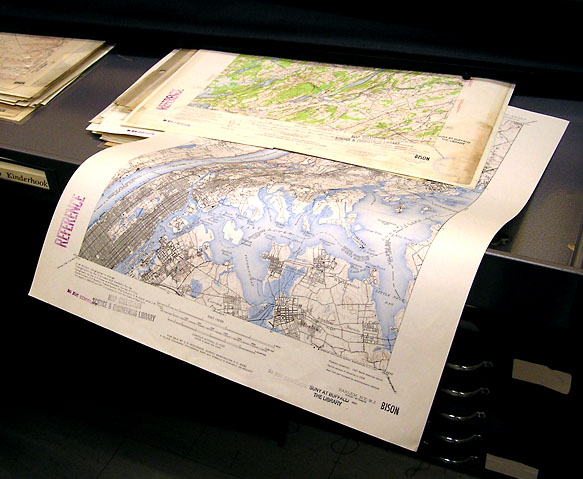
Topographic
maps have contours and spot heights, among other features that are rendered.
Note also the Bench Mark (BM) and the Contour interval (10 feet on this
map). The interval refers to the distance between two points where the
elevation increases/decreases by 10 feet. This changes depending on the
"contour interval" of the map. (See next image) |
|
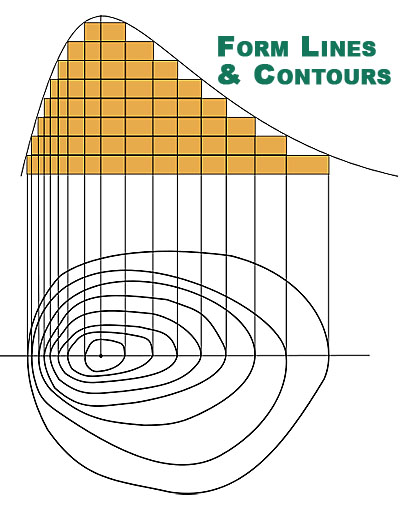
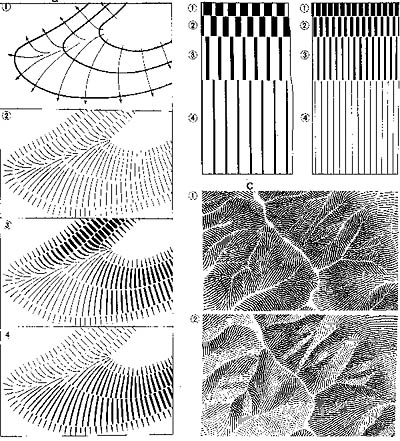
Contours and form lines are drawn on a map by projecting the 3-D ground onto a flat surface. |
|
|
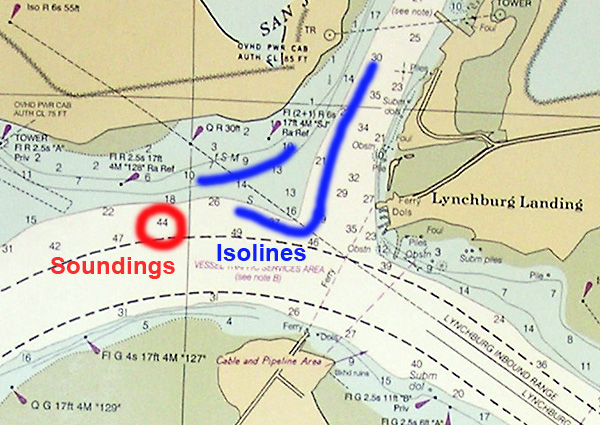
Nautical chart showing both
ISOLINES and SOUNDINGS. These relate to topographic maps as contours
and spot heights. |
|
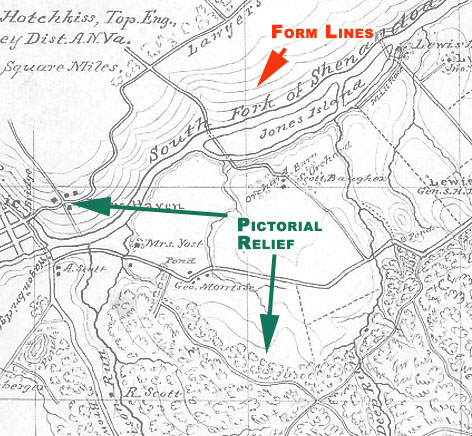
Map showing hachures and pictorial relief. |
|
How hachures are developed (different methods). |
|
The map below shows both form lines and pictorial relief. |
|
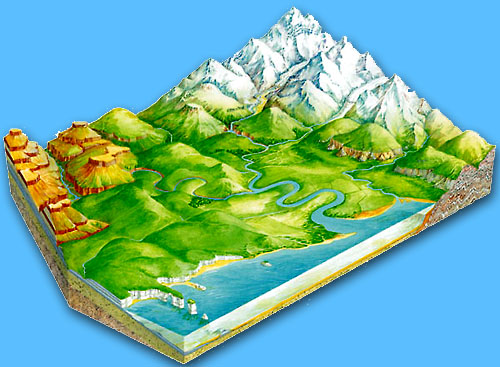
Landform maps show relief in a more pictorial way. The shapes are general and not specific to the place being mapped. |
|
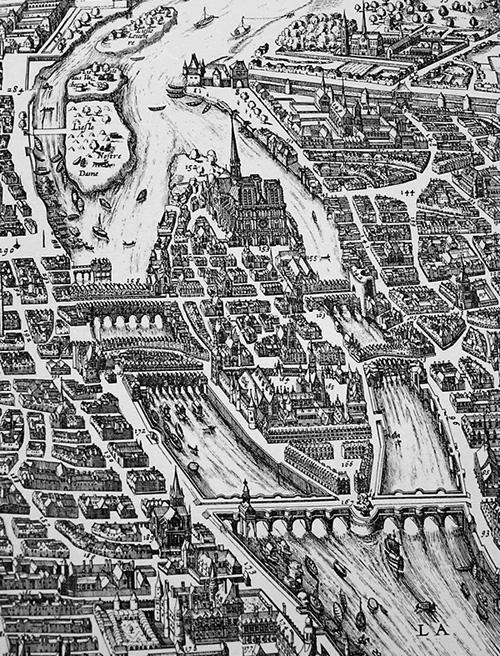
Portion of a bird's eye view of Paris |
|
|
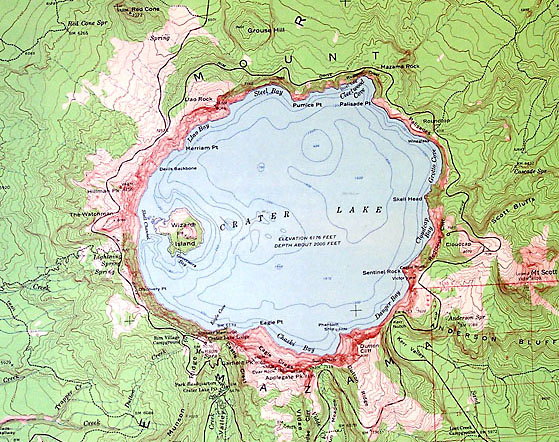
Topographic-Bathymetric map of Crater
Lake. Compare with below edition that includes different relief
techniques. 500 Relief shown
by contours and spot heights. Depth shown by isolines and soundings. |
|
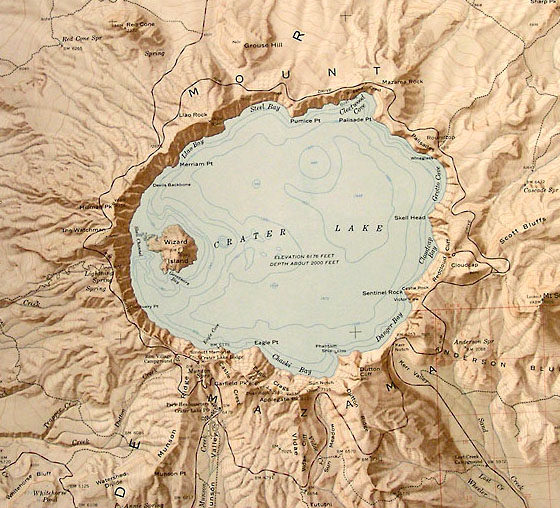
Topographic-Bathymetric map of Crater Lake. (Shading is added; contours still exist but are toned down.)
500 Relief shown by
shading
and spot heights. Depth shown by isolines and soundings.
In this situation, if the contours are considered significant to note, then the following would be valid:
500 Relief shown by
shading, contours,
and spot heights. Depth shown by isolines and soundings. |
|
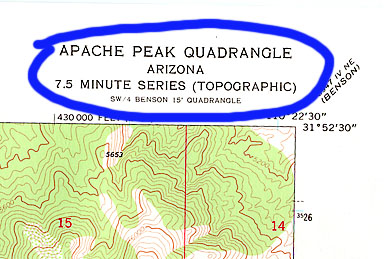
Typical topographic map layout. Filing
title and dates, along with other descriptive data is found along the
bottom edge of the sheet. |
|
|
|
|
|
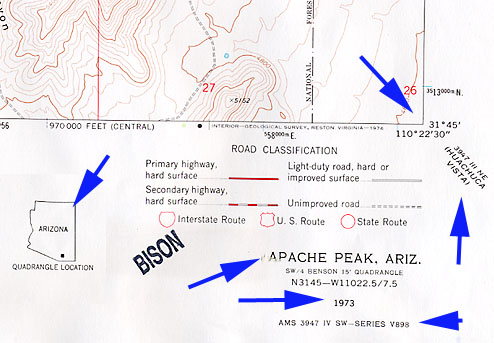
Filing title, date, series (note type), other data. |
|
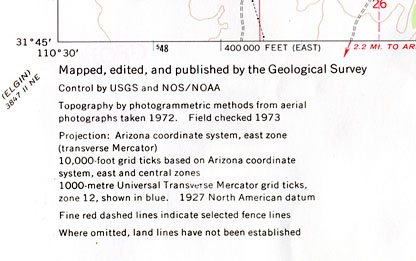
Statement of responsibility, additional notes on compilation
and date information. |
|
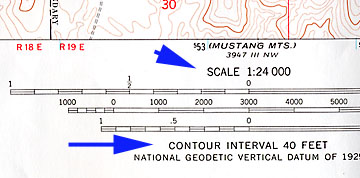
Scale and contour data (for scale and for note on contour
intervals). |
|
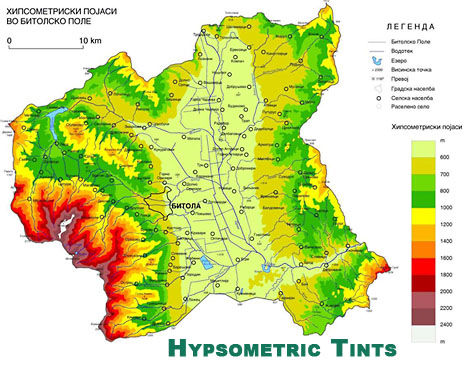
This uses hypsometric (elevation) tints to display relative elevations. |
|
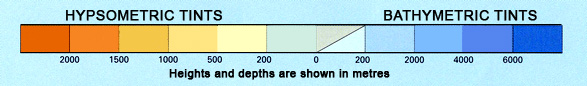
When this type of bar appears on a map, it is a tip-off that hypsometric tints are being used. |
|
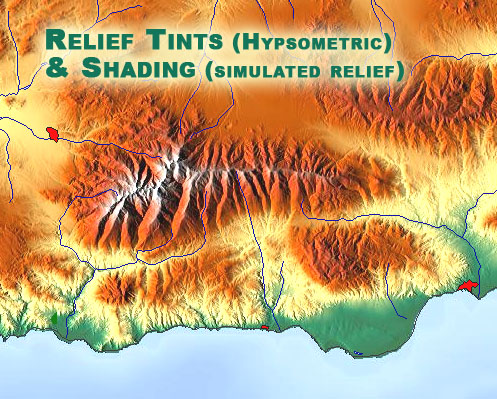
This shows both hypsometric (elevation) color use, and shading to show relative relief. |
|
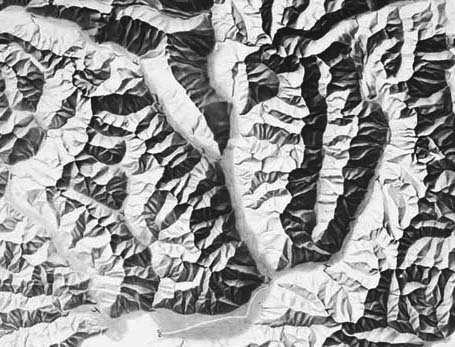
Shaded relief map (only shading is used on this example). |
|
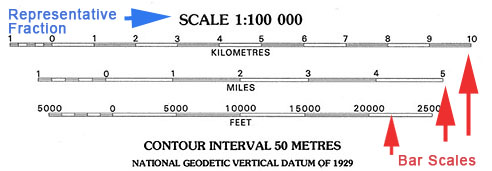
Example of a Bar Scale and Representative Fraction (scale ratio) |
|
|