
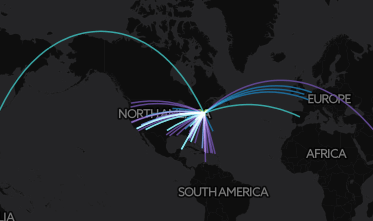
Project 1: Carto
This project entailed the creation of interactive flow maps of airline travel from various cities.
Project 2: QGIS
This project entailed the creation of 2012 and 2016 electoral maps using QGIS.
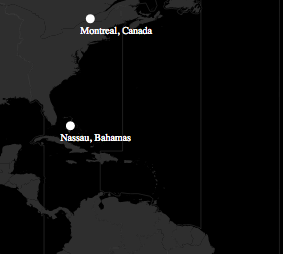
Project 3: Leaflet
This project entailed the creation of electoral maps using Leaflet.
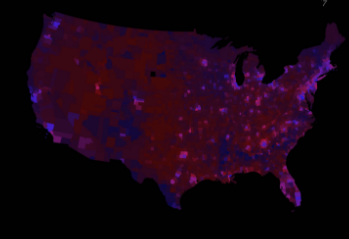
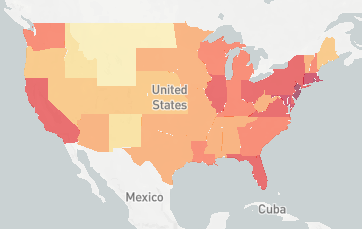
Project 4: D3
This project entailed the creation of choropleth and dot density maps using D3.
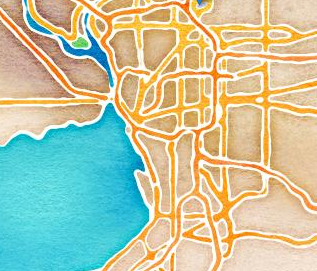
Project 5: Mapbox
This project entailed the creation of choropleth and proportional symbol maps using Mapbox.
Challenge: Homelessness In Western New York
This project entailed the visualization of a dataset containing anonymized information on Homelessness in Western New York in 2015. The dataset used to create this project was graciously provided by the Homeless Alliance of Western New York.
