SPARCS

SPARCS data (see here for info)

In [1]:
import pandas
In [2]:
# cleaning the data
mycons = {'Total Costs':lambda x:float(x.replace('$','')),
          'Total Charges':lambda x:float(x.replace('$','')),
          'Length of Stay':lambda x:int(x.replace('+',''))}
s = pandas.read_csv('sparcs2014.csv',converters=mycons)
s.head()
Out[2]:
Health Service Area Hospital County Operating Certificate Number Facility Id Facility Name Age Group Zip Code - 3 digits Gender Race Ethnicity ... Payment Typology 2 Payment Typology 3 Attending Provider License Number Operating Provider License Number Other Provider License Number Birth Weight Abortion Edit Indicator Emergency Department Indicator Total Charges Total Costs
0 Western NY Allegany 226700.0 37.0 Cuba Memorial Hospital Inc 30 to 49 147 F White Not Span/Hispanic ... NaN NaN 90335341.0 NaN NaN 0 N Y 9546.85 12303.20
1 Western NY Allegany 226700.0 37.0 Cuba Memorial Hospital Inc 50 to 69 147 F White Not Span/Hispanic ... NaN NaN 90335341.0 NaN NaN 0 N Y 11462.75 10298.32
2 Western NY Allegany 226700.0 37.0 Cuba Memorial Hospital Inc 18 to 29 147 M White Not Span/Hispanic ... NaN NaN 90335341.0 167816.0 NaN 0 N Y 1609.40 1966.25
3 Western NY Allegany 226700.0 37.0 Cuba Memorial Hospital Inc 18 to 29 147 F White Not Span/Hispanic ... NaN NaN 90335341.0 167816.0 NaN 0 N Y 2638.75 2863.94
4 Western NY Allegany 226700.0 37.0 Cuba Memorial Hospital Inc 18 to 29 147 F White Not Span/Hispanic ... NaN NaN 90335341.0 NaN NaN 0 N Y 3538.25 4656.77

5 rows × 39 columns

In [3]:
pop2014 = 19.75e6
int(s['Total Charges'].sum()/pop2014)
Out[3]:
4812
In [4]:
print(s['Total Charges'].max())
print(s['Total Costs'].max())
8593455.88
5458504.44
In [5]:
itcmax = s['Total Charges'].idxmax()# index of row in which the charages are the highest
s.iloc[itcmax] # get data in row for the most expensive hospital visit
Out[5]:
Health Service Area                                                        New York City
Hospital County                                                                    Bronx
Operating Certificate Number                                                 7.00001e+06
Facility Id                                                                         1169
Facility Name                          Montefiore Medical Center - Henry & Lucy Moses...
Age Group                                                                        0 to 17
Zip Code - 3 digits                                                                  104
Gender                                                                                 M
Race                                                              Black/African American
Ethnicity                                                              Not Span/Hispanic
Length of Stay                                                                       120
Admit Day of Week                                                                    FRI
Type of Admission                                                              Emergency
Patient Disposition                                         Home w/ Home Health Services
Discharge Year                                                                      2014
Discharge Day of Week                                                                TUE
CCS Diagnosis Code                                                                    63
CCS Diagnosis Description                                        WHITE BLOODCELL DISEASE
CCS Procedure Code                                                                    64
CCS Procedure Description                                         BONE MARROW TRANSPLANT
APR DRG Code                                                                           3
APR DRG Description                                               BONE MARROW TRANSPLANT
APR MDC Code                                                                          16
APR MDC Description                    Diseases and Disorders of Blood, Blood Forming...
APR Severity of Illness Code                                                           4
APR Severity of Illness Description                                              Extreme
APR Risk of Mortality                                                            Extreme
APR Medical Surgical Description                                                Surgical
Payment Typology 1                                              Private Health Insurance
Payment Typology 2                                                              Self-Pay
Payment Typology 3                                                                   NaN
Attending Provider License Number                                                 198304
Operating Provider License Number                                                 229870
Other Provider License Number                                                        NaN
Birth Weight                                                                           0
Abortion Edit Indicator                                                                N
Emergency Department Indicator                                                         N
Total Charges                                                                8.59346e+06
Total Costs                                                                  2.96142e+06
Name: 965564, dtype: object
In [6]:
itcmin = s['Total Charges'].idxmin()
s.iloc[itcmin] # get data in row for the least expensive hospital visit
Out[6]:
Health Service Area                                                       New York City
Hospital County                                                               Manhattan
Operating Certificate Number                                                  7.002e+06
Facility Id                                                                        1439
Facility Name                                                   Mount Sinai Beth Israel
Age Group                                                                   70 or Older
Zip Code - 3 digits                                                                 100
Gender                                                                                M
Race                                                                              White
Ethnicity                                                             Not Span/Hispanic
Length of Stay                                                                        1
Admit Day of Week                                                                   WED
Type of Admission                                                                Urgent
Patient Disposition                                                             Expired
Discharge Year                                                                     2014
Discharge Day of Week                                                               THU
CCS Diagnosis Code                                                                  108
CCS Diagnosis Description                                                           CHF
CCS Procedure Code                                                                    0
CCS Procedure Description                                                       NO PROC
APR DRG Code                                                                        194
APR DRG Description                                                       HEART FAILURE
APR MDC Code                                                                          5
APR MDC Description                    Diseases and Disorders of the Circulatory System
APR Severity of Illness Code                                                          1
APR Severity of Illness Description                                               Minor
APR Risk of Mortality                                                          Moderate
APR Medical Surgical Description                                                Medical
Payment Typology 1                                             Private Health Insurance
Payment Typology 2                                                             Self-Pay
Payment Typology 3                                                                  NaN
Attending Provider License Number                                                251948
Operating Provider License Number                                                   NaN
Other Provider License Number                                                       NaN
Birth Weight                                                                          0
Abortion Edit Indicator                                                               N
Emergency Department Indicator                                                        N
Total Charges                                                                       0.5
Total Costs                                                                        0.13
Name: 1424707, dtype: object
In [7]:
meantc = s['Total Charges'].mean()
meantc
Out[7]:
40184.17084982944
In [8]:
mediantc = s['Total Charges'].median()
mediantc
Out[8]:
21872.93
In [9]:
from histogram1d import histogram1d
In [10]:
len(s)
Out[10]:
2365208
In [11]:
from numpy import *
def histogram1d(xall,xmin,xmax,nbinsx=10,rawcounts=False):
    xfac = float(nbinsx)/float(xmax-xmin)
    inbox = logical_and(xall>=xmin,xall<xmax);
    x = xall[ inbox ]
    ix = array( (x-xmin)*xfac, dtype=int )
    counts = zeros(nbinsx,dtype=int)
    add.at( counts, ix, 1 )
    dx = (xmax-xmin)/float(nbinsx)
    #bincenters = linspace(xmin,xmax,nbinsx+1)[:-1]+0.5*dx
    left        = linspace(xmin,xmax,nbinsx+1)[:-1] # left ends of bins

    if rawcounts:
       #return bincenters,counts
       return left,counts
    else:
        # return probability density samples
        #return bincenters, counts/(dx*float(len(xall)))
        return left, counts/(dx*float(len(xall)))
In [12]:
mincharge = s['Total Charges'].min()
maxcharge = s['Total Charges'].max()
lefts,p = histogram1d(s['Total Charges'],mincharge,maxcharge,100)
lefts
Out[12]:
array([  5.00000000e-01,   8.59350538e+04,   1.71869608e+05,
         2.57804161e+05,   3.43738715e+05,   4.29673269e+05,
         5.15607823e+05,   6.01542377e+05,   6.87476930e+05,
         7.73411484e+05,   8.59346038e+05,   9.45280592e+05,
         1.03121515e+06,   1.11714970e+06,   1.20308425e+06,
         1.28901881e+06,   1.37495336e+06,   1.46088791e+06,
         1.54682247e+06,   1.63275702e+06,   1.71869158e+06,
         1.80462613e+06,   1.89056068e+06,   1.97649524e+06,
         2.06242979e+06,   2.14836435e+06,   2.23429890e+06,
         2.32023345e+06,   2.40616801e+06,   2.49210256e+06,
         2.57803711e+06,   2.66397167e+06,   2.74990622e+06,
         2.83584078e+06,   2.92177533e+06,   3.00770988e+06,
         3.09364444e+06,   3.17957899e+06,   3.26551354e+06,
         3.35144810e+06,   3.43738265e+06,   3.52331721e+06,
         3.60925176e+06,   3.69518631e+06,   3.78112087e+06,
         3.86705542e+06,   3.95298997e+06,   4.03892453e+06,
         4.12485908e+06,   4.21079364e+06,   4.29672819e+06,
         4.38266274e+06,   4.46859730e+06,   4.55453185e+06,
         4.64046641e+06,   4.72640096e+06,   4.81233551e+06,
         4.89827007e+06,   4.98420462e+06,   5.07013917e+06,
         5.15607373e+06,   5.24200828e+06,   5.32794284e+06,
         5.41387739e+06,   5.49981194e+06,   5.58574650e+06,
         5.67168105e+06,   5.75761560e+06,   5.84355016e+06,
         5.92948471e+06,   6.01541927e+06,   6.10135382e+06,
         6.18728837e+06,   6.27322293e+06,   6.35915748e+06,
         6.44509204e+06,   6.53102659e+06,   6.61696114e+06,
         6.70289570e+06,   6.78883025e+06,   6.87476480e+06,
         6.96069936e+06,   7.04663391e+06,   7.13256847e+06,
         7.21850302e+06,   7.30443757e+06,   7.39037213e+06,
         7.47630668e+06,   7.56224123e+06,   7.64817579e+06,
         7.73411034e+06,   7.82004490e+06,   7.90597945e+06,
         7.99191400e+06,   8.07784856e+06,   8.16378311e+06,
         8.24971766e+06,   8.33565222e+06,   8.42158677e+06,
         8.50752133e+06])
In [13]:
%pylab inline
bar(lefts,p,lefts[1]-lefts[0],color='m',alpha=0.4)
Populating the interactive namespace from numpy and matplotlib
Out[13]:
<BarContainer object of 100 artists>
In [14]:
lefts,p = histogram1d(s['Total Charges'],mincharge,maxcharge/100,100)
In [15]:
bar(lefts,p,lefts[1]-lefts[0],color='m',alpha=0.4) # bar widths
Out[15]:
<BarContainer object of 100 artists>
In [16]:
lefts,p = histogram1d(log10(s['Total Charges']),log10(mincharge),log10(maxcharge),100)
bar(lefts,p,lefts[1]-lefts[0],color='m',alpha=0.4)
Out[16]:
<BarContainer object of 100 artists>
In [17]:
lefts,p = histogram1d(log10(s['Total Charges']),3,6,100)
bar(lefts,p,lefts[1]-lefts[0],color='m',alpha=0.4)
xlabel('log(total charges)')
ylabel('probability')
Out[17]:
Text(0,0.5,'probability')

This data looks log normal

Let's fit a Gaussian distribution to this data

In [18]:
def gaussian(x,mu,sigma): 
    return (1/sqrt(2*pi)/sigma)*exp(-(x-mu)**2/2/sigma**2)
In [19]:
lc = log10(s['Total Charges'])#log charges
lefts,p = histogram1d(lc,3,6,100)
w = lefts[1]-lefts[0] # width or step size
bar(lefts,p,lefts[1]-lefts[0],color='m',alpha=0.4)
mu = lc.mean() # mean of lc
sigma = lc.std() # standard devtiation of lc
plot(lefts+w/2,gaussian(lefts+w/2,mu,sigma),'r',lw=3,alpha=0.5) # plots gaussian with same mean and std
Out[19]:
[<matplotlib.lines.Line2D at 0x1229ac6a0>]

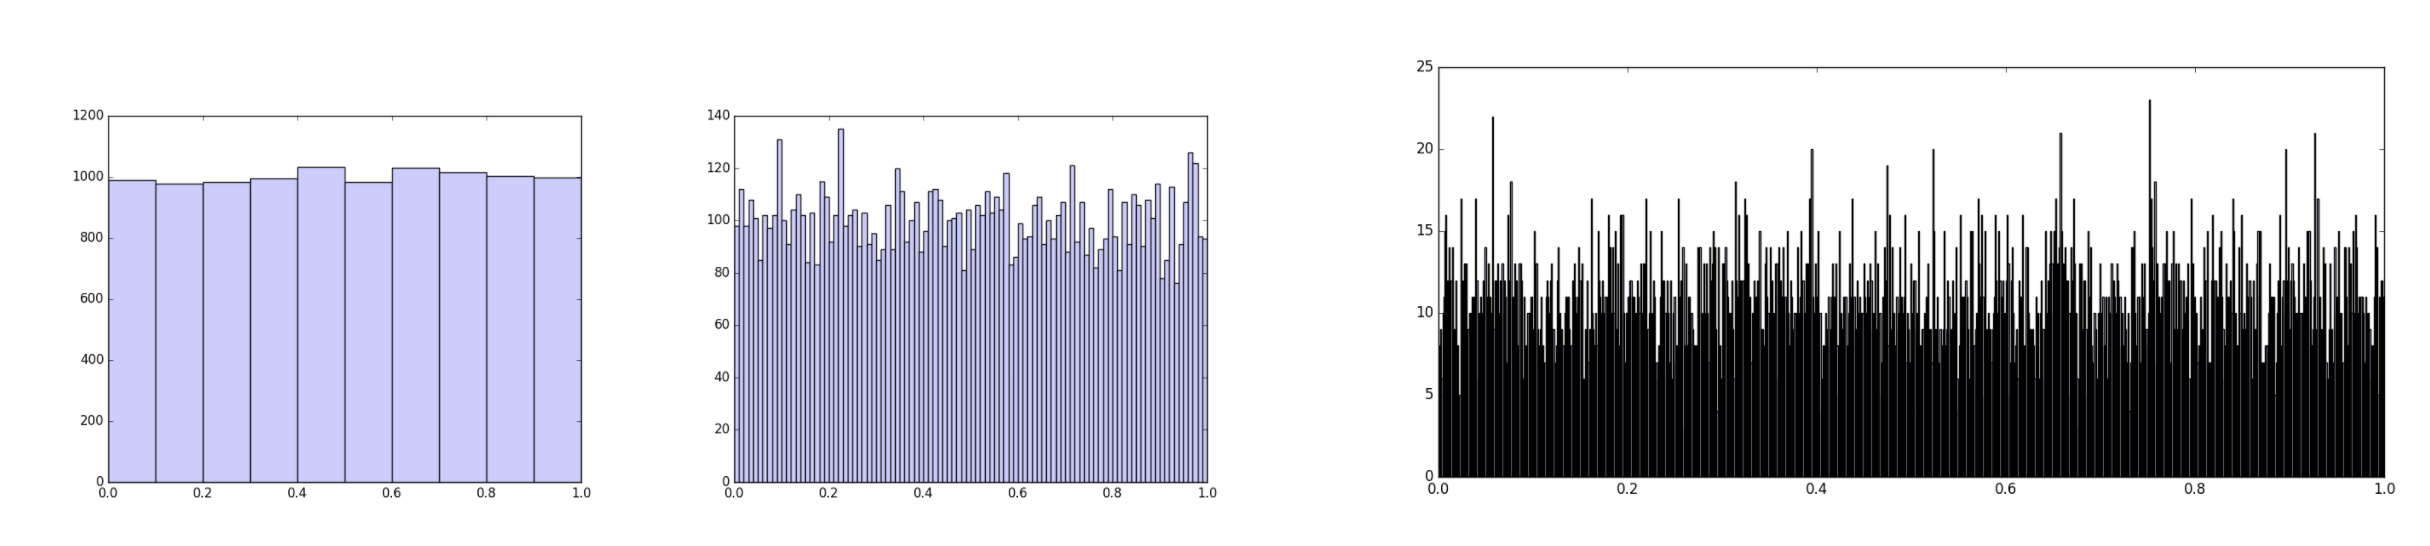
Often, when making histograms we try to find a happy medium between low resolution (too few bins) and noisy bin heights (too many bins). This is appropriate when the data values are believed to be essentially random numbers with a probability density that varies slowly on the scale of bins.

In [ ]:
from numpy import *
from histogram1d import histogram1d
import matplotlib.pyplot as pl
N = 10000
x = random.rand(N)
pl.ion()

while True:
        n=int(input('n = '))
        if n<=0: break
        print('N/n = ',round(N/n,1),'sqrt(N/n) = ',round(sqrt(N/n),1),'sqrt(N/n)/(N/n) = ', sqrt(N/n)/(N/n) )
        lefts,counts = histogram1d(x,0,1,n,rawcounts=True)
        w = lefts[1]-lefts[0]
        pl.clf()
        pl.bar(lefts,counts,w,color='#ccccff')
        pl.xlim(0,1)
        pl.draw()

pl.ioff()
input()

Mean bin occupancy: 1000, 100, 10 respectively (data the same for all 3 cases):

Quiz: "bin size": What should the average bin occupancy be so that the noise is about 5%?

[Poisson variance is N/n. Binomial variance is (N/n)(1-1/n) ~ N/n.]

But other times, like the present context of hospital charges, a very fine grain may be appropriate, and large differences in adjacent bar heights can be real and meaningful.

Exercise: Make a very fine-grained histogram of the log10 of the charges for "LIVEBORN" at Maimonides Medical Center.

In [ ]:
mmc = s[ s['Facility Name']=='Maimonides Medical Center' ]
mmcbabies = mmc[ mmc['CCS Diagnosis Description'] == 'LIVEBORN' ]
babylogcharges = log10(mmcbabies['Total Charges'])
babymax = babylogcharges.max()
babymin = babylogcharges.min()

from histogram1d import histogram1d
import matplotlib.pyplot as pl
lefts, counts = histogram1d(babylogcharges, babymin,babymax, 10000, rawcounts=True)
w = lefts[1]-lefts[0]
values = lefts + w/2
x = vstack([values,values])
y = vstack([zeros_like(counts), counts])
pl.figure(figsize=(12,6))
pl.plot(x,y,'b')
pl.show()

Exercise 1:

a. How many of each kind of Patient Disposition on discharge were there?

b. What fraction of inpatients died in hospital?

Exercise 2:

a. What are people diagnosed with? How many with each 'CCS Diagnosis Description'?

b. What about just those with .str.contains('CANCER') ?

In [ ]:
a = s['Patient Disposition']
g = s.groupby('Patient Disposition')
for name,item in g: 
    print(name)
In [ ]:
g['Patient Disposition'].count()
In [ ]:
g['Total Charges'].mean()
In [ ]:
len(unique(s['Patient Disposition']))