In [1]:
import matplotlib.pyplot as pl
import matplotlib.pyplot as pl
from numpy import *

def create_clustered_data(d,k,npercluster,r):
    n = k*npercluster # total number points

    # generate random points in unit square that are at least 2r apart
    centers = [random.rand(d)]
    while len(centers)<k:
            trialcenter = random.rand(d)
            farenough = True # optimistic!
            for center in centers:
                    if linalg.norm(trialcenter-center,inf) < 2*r:
                            farenough = False
                            break
            if farenough: centers.append(trialcenter)
    centers = array(centers)
    F = empty((n,d))
    for i in range(k):
        # create a cluster
        start =     i*npercluster
        stop  = (i+1)*npercluster
        F[start:stop,:] = centers[i] + r*(2*random.rand(npercluster,d)-1)

    return F,n

def plot_data_and_means(F,k,means,assignments):
    colors = 'rgbmc' # red, green, blue, magenta, cyan
    for i in range(k):
        cluster = assignments==i
        pl.plot(F[cluster,0],F[cluster,1],'.',color=colors[i],alpha=0.95);
        pl.plot(means[i][0],means[i][1],'o',color=colors[i],markersize=50,alpha=0.1)
        pl.plot(means[i][0],means[i][1],'.',color='k')
    pl.xlim(-r,1+r); pl.ylim(-r,1+r)
    return

def initialize_kmeans(F,k):
    center = zeros(k,dtype=int)
    center[0] = random.randint(n)
    x = zeros((n,k))
    for i in range(k-1):
        x[:,i] = sum(square(F[center[i],:] - F),axis=1)
        #plot(x[:,i])
        center[i+1] = argmax(amin(x[:,0:(i+1)],axis=1))

    means = F[center,:]
    displacements = F[:,:,newaxis] - means.T   # create 3D array  (done after class)
    sqdistances = (displacements**2).sum(axis=1) # Euclidean distance
    assignments = argmin( sqdistances, axis=1 )

    return means,assignments

def run_kmeans(F,k,max_iterations):
    n=shape(F)[0]
    oldassignments = k*ones(n,dtype=int)
    count = 0
    while(True):
        count += 1
        if count>max_iterations: break

        # compute the cluster assignments
        displacements = F[:,:,newaxis] - means.T   # create 3D array  (done after class)
        sqdistances = (displacements**2).sum(axis=1)
        assignments = argmin( sqdistances, axis=1 )
        #print(assignments)
        if all( assignments == oldassignments ): break
        oldassignments[:] = assignments

        # update the means as the centroids of the clusters
        for i in range(k):
            means[i] = F[assignments==i].mean(axis=0)
        return means,assignments
So here's kmeans with nice initialization
In [2]:
d,k,npercluster,r,max_iterations = 2,5,25,0.05,100
F,n = create_clustered_data(d,k,npercluster,r)
means,assignments = initialize_kmeans(F,k)
means,assignments = run_kmeans(F,k,max_iterations)
plot_data_and_means(F,k,means,assignments)

Now for community detection. First compute distances between points
In [3]:
from pylab import *

displacements = F[:,:,newaxis] - F[:,:,newaxis].T

print(shape(displacements))
# displacements(i,0,k) gives difference between x_i and x_k
# displacements(i,1,k) gives difference between y_i and y_k

distances = (displacements**2).sum(axis=1)**.5 # Euclidean distance between all pairs of points
#print(shape(distances))
imshow(distances)
Out[3]:

Make network such that there are edges between nearby points
In [6]:
A = (distances<.05) - eye(n) # subtract identity matrix to remove self-edges
imshow(A) # here, yellow dots indicate and edge from node i to node j
edges = array((A).nonzero()).T
shape(edges)
Out[6]:

Use package networkX to analyze network data
In [8]:
from networkx import *
G = from_numpy_matrix(A)
nx.draw(G,node_size=10)
connected_components = sorted(nx.connected_components(G), key = len, reverse=True)

In [12]:
print(connected_components)
components_vector = zeros(n)
for i in range(len(connected_components)):
    ids = [int(x) for x in list(connected_components[i])]
    components_vector[ids] = i
components_vector
Out[12]:
In [13]:
nx.draw_networkx_nodes(G, pos=F, node_color=components_vector, node_size=10,alpha=0.8)
nx.draw_networkx_edges(G, pos=F, alpha=0.1)
shape(components_vector)
Out[13]:

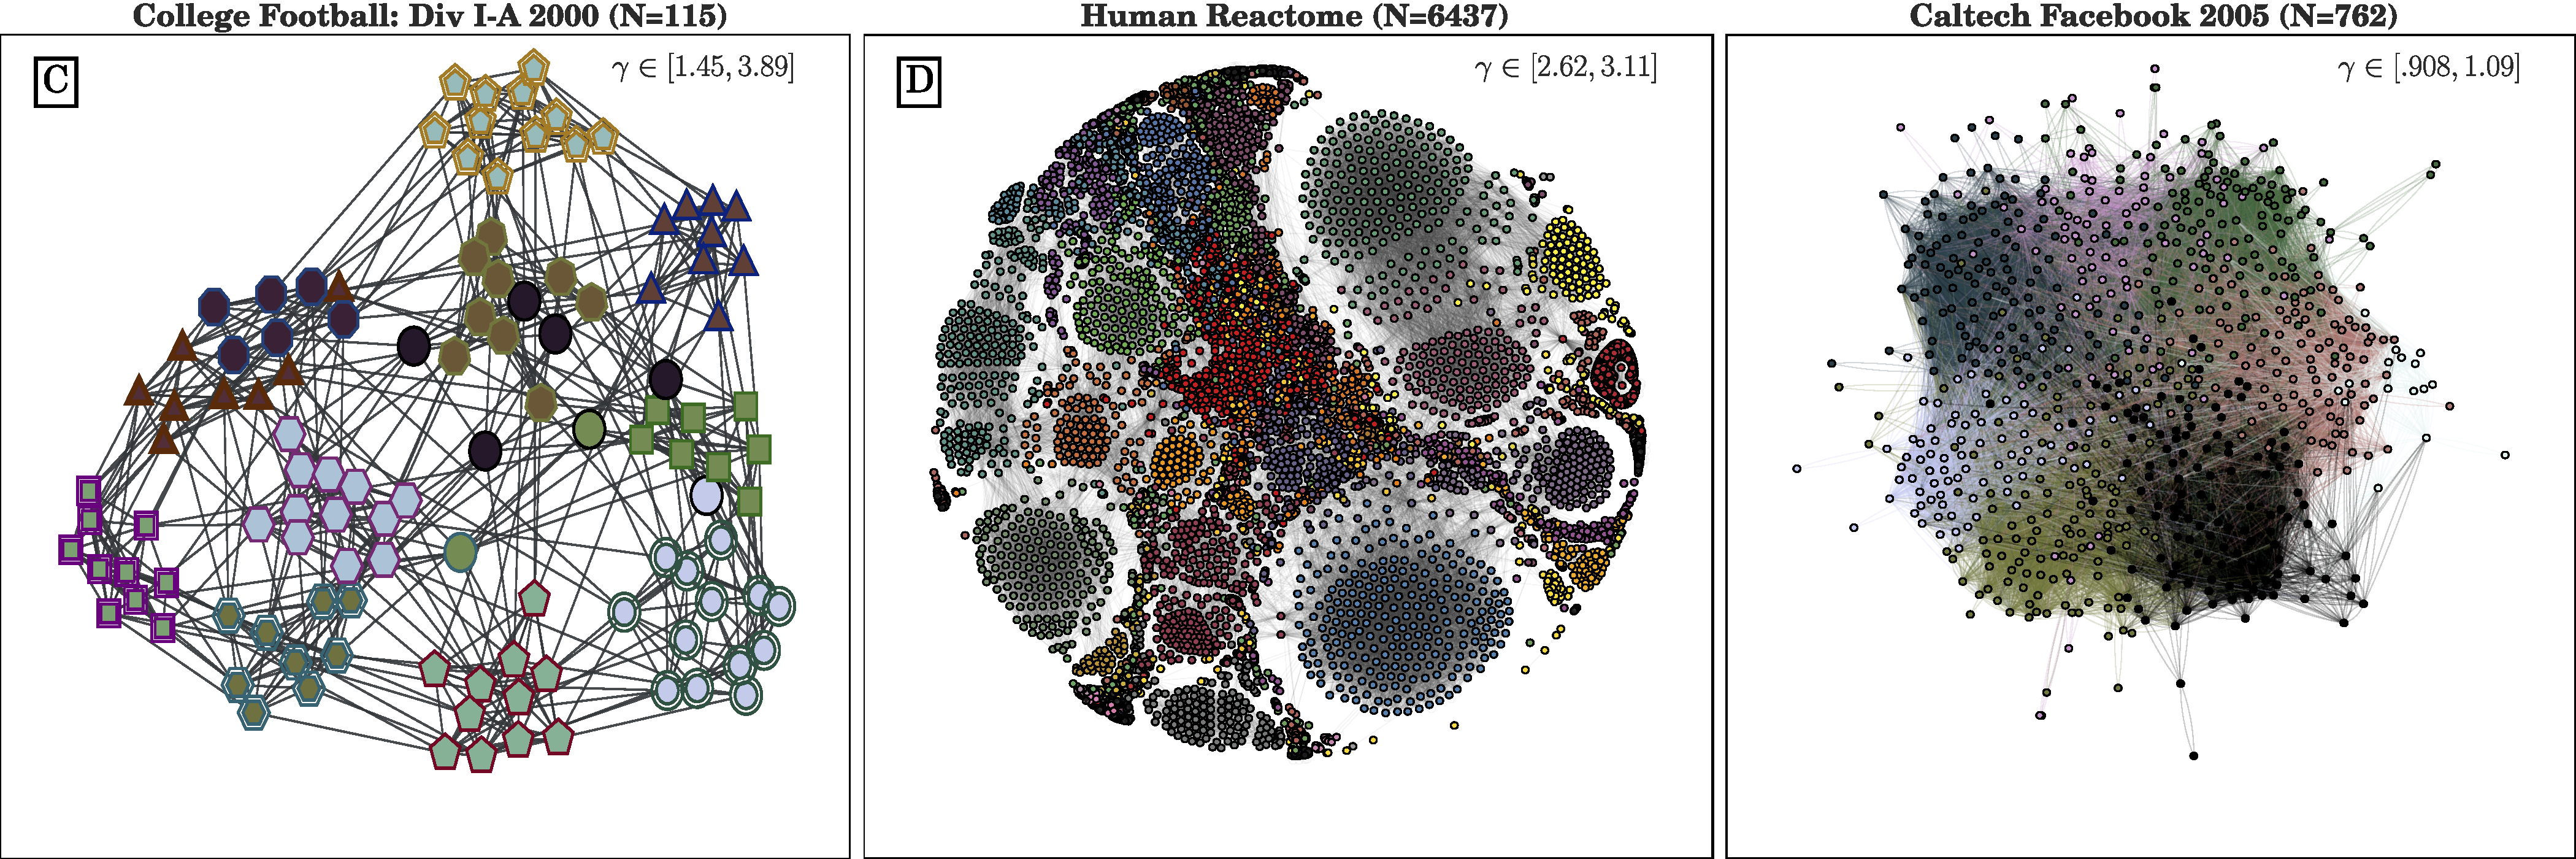
Connected components work if the data is not noisy. If there are some edges between clusters (i.e., communities), you will need a better community detection algorithm.
download network file call football.gml
http://www.acsu.buffalo.edu/~danet/Sp18/MTH448/class23/class23_files/football.gml
In [16]:
H = nx.read_gml('football.gml') # graph markup language  -- this is somebodies xml design
#nx.draw_networkx_nodes(H,pos=nx.spring_layout(H))
nx.draw(H,pos=nx.spring_layout(H))

In [17]:
# you must install with:       pip install python-louvain
import community
partition = community.best_partition(H)# this finds the clusters using one algorithm

color_vec = list(partition.values())# we need a vector with the cluster ids to show clusters using color in a plot

labels2 = {a:a for a in list(nodes(H))} # to plot labels, you need a dictionary

nx.draw(H,pos=nx.spring_layout(H),node_color=color_vec,labels=labels2,font_size=10,alpha=.6 )