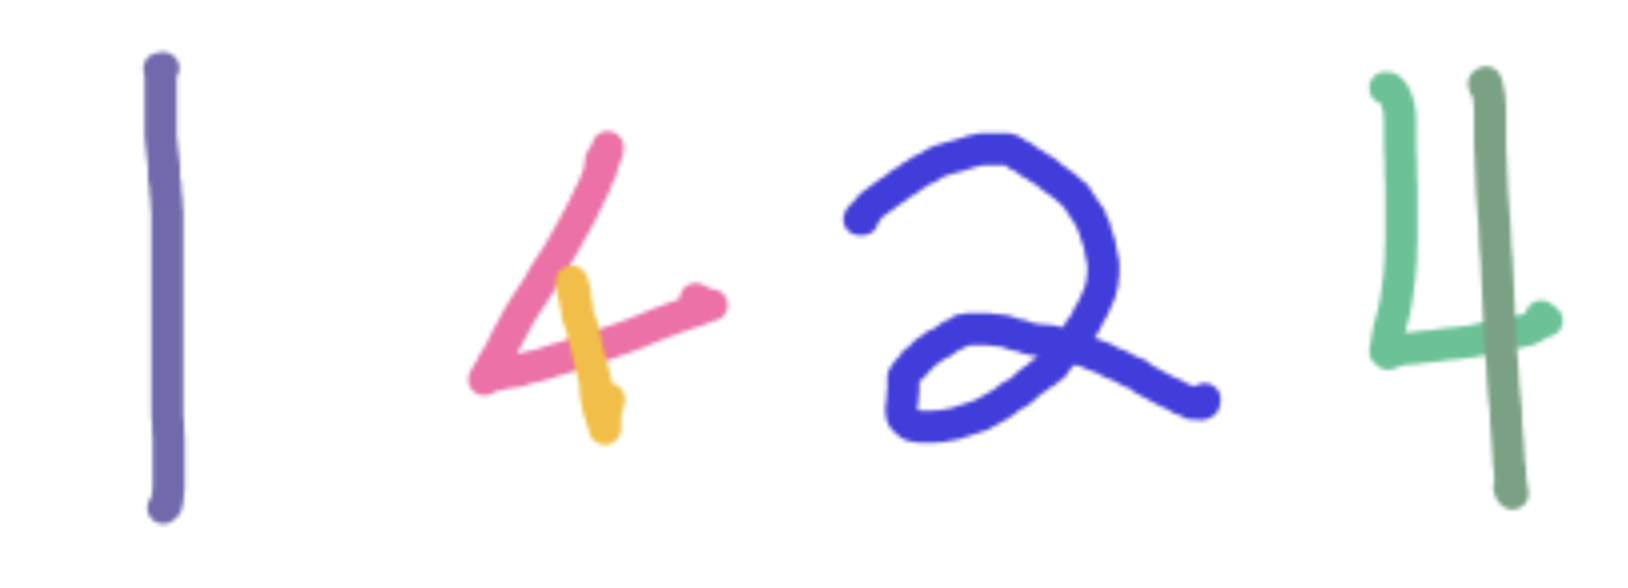
What might some distinctive features be for the following data?
A set of handwritten characters

Sometimes features are not necessary - they just become a side problem. For many other applications, it is beneficial to use intuition to identify distinctive features. Often, however, the features must be sought out and identified learned from the data itself.
These efforts/algorithms can be supervised or unsupervised, and machine learning describes the automating the tasks of data analysis, feature selection and classification. (clickbait)
Let's consider some linearly separable data
In [51]:
from numpy import *
%pylab inline

d = 2 #2 dimensions
n = 500 #data points
x = random.rand(d,n) #randomly place points in 2D
#print(x)
subplot(111,aspect=1)
plot(x[0],x[1],'o')
Out[51]:
lets draw a line and split the points into 2 groups, above vs below the line
In [55]:
# lets use the line y = 1/3 + 2/3 x, or 0=-1-2x+3y

y = sign(dot(array([-2,+3.]),x) - 1)
#print(y)
xp = x.T[y>0].T
xm = x.T[y<0].T
subplot(111,aspect=1)
plot(xp[0],xp[1],'ro')
plot(xm[0],xm[1],'bo');
let's open up a little space between the classes
In [56]:
# let's open up a little space between the classes
halfgap = 0.05
x[-1,][y>0] += halfgap
x[-1,][y<0] -= halfgap
In [57]:
xp = x.T[y>0].T
xm = x.T[y<0].T
subplot(111,aspect=1)
plot(xp[0],xp[1],'ro')
plot(xm[0],xm[1],'bo');