Advice for Report 2 (due Saturday March 17 at midnight)
Project Summary and Update
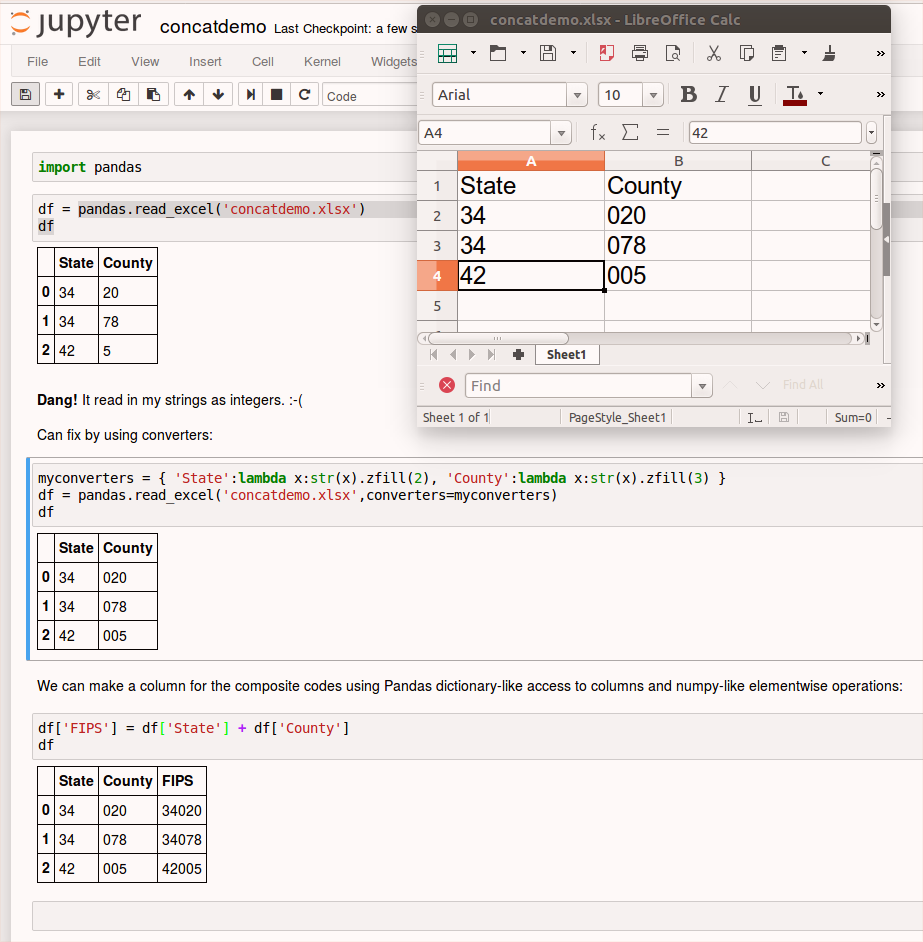
I recommend downloading and modifying this file instead:
Find some interesting data for every county in the US Search online for some data given for every county in the nation.
You may want to consult this page about the FIPS codes for counties.
Fall-back suggestion: if you don't find anything else good: annual unemployment data from the US Bureau of Labor Statistics.
Color the counties on the map according to your data
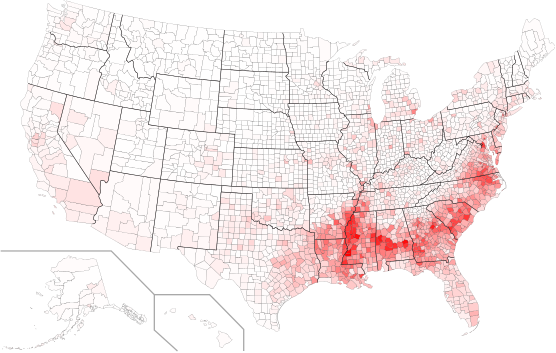
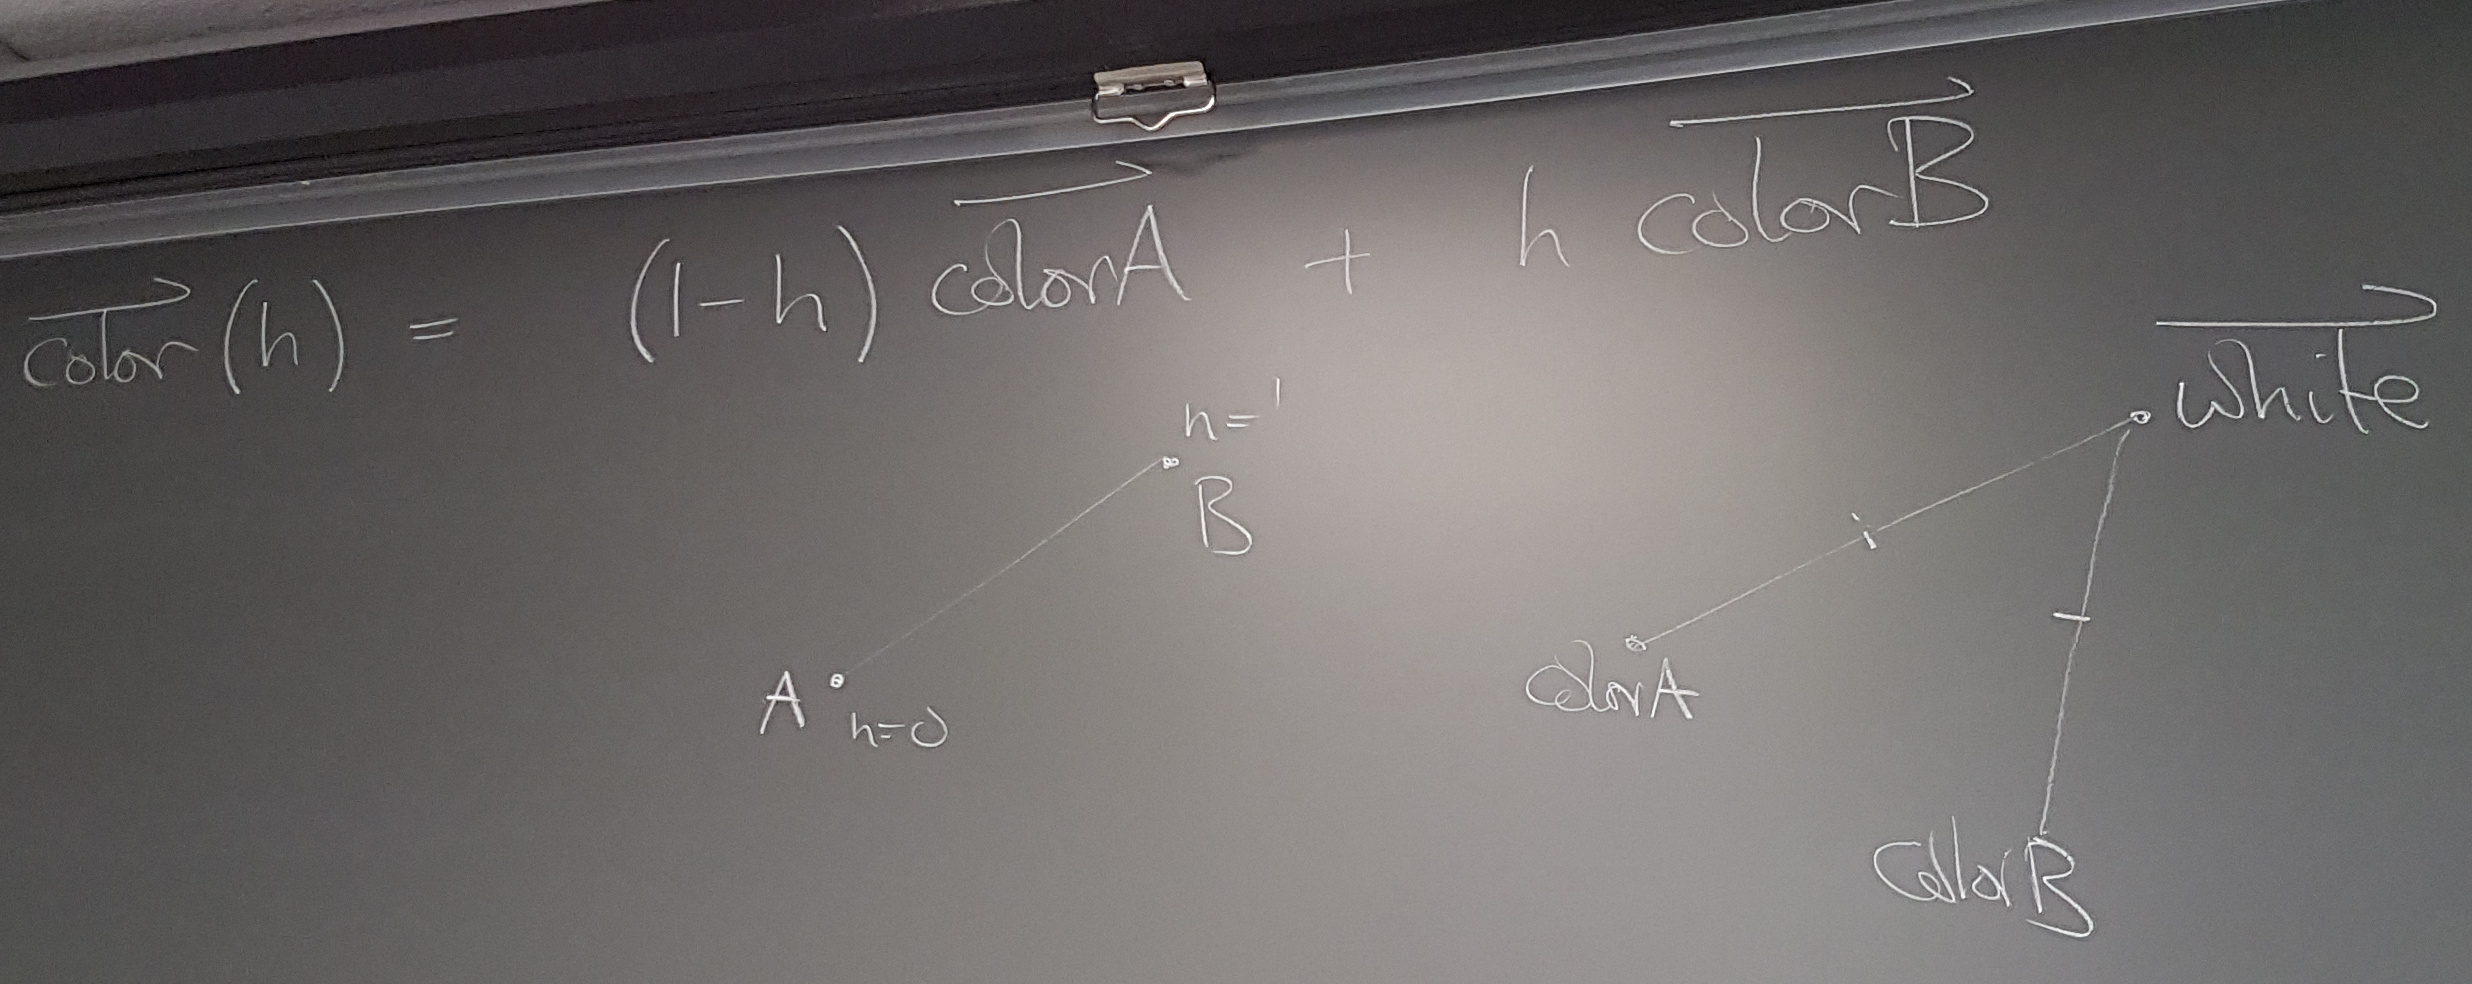
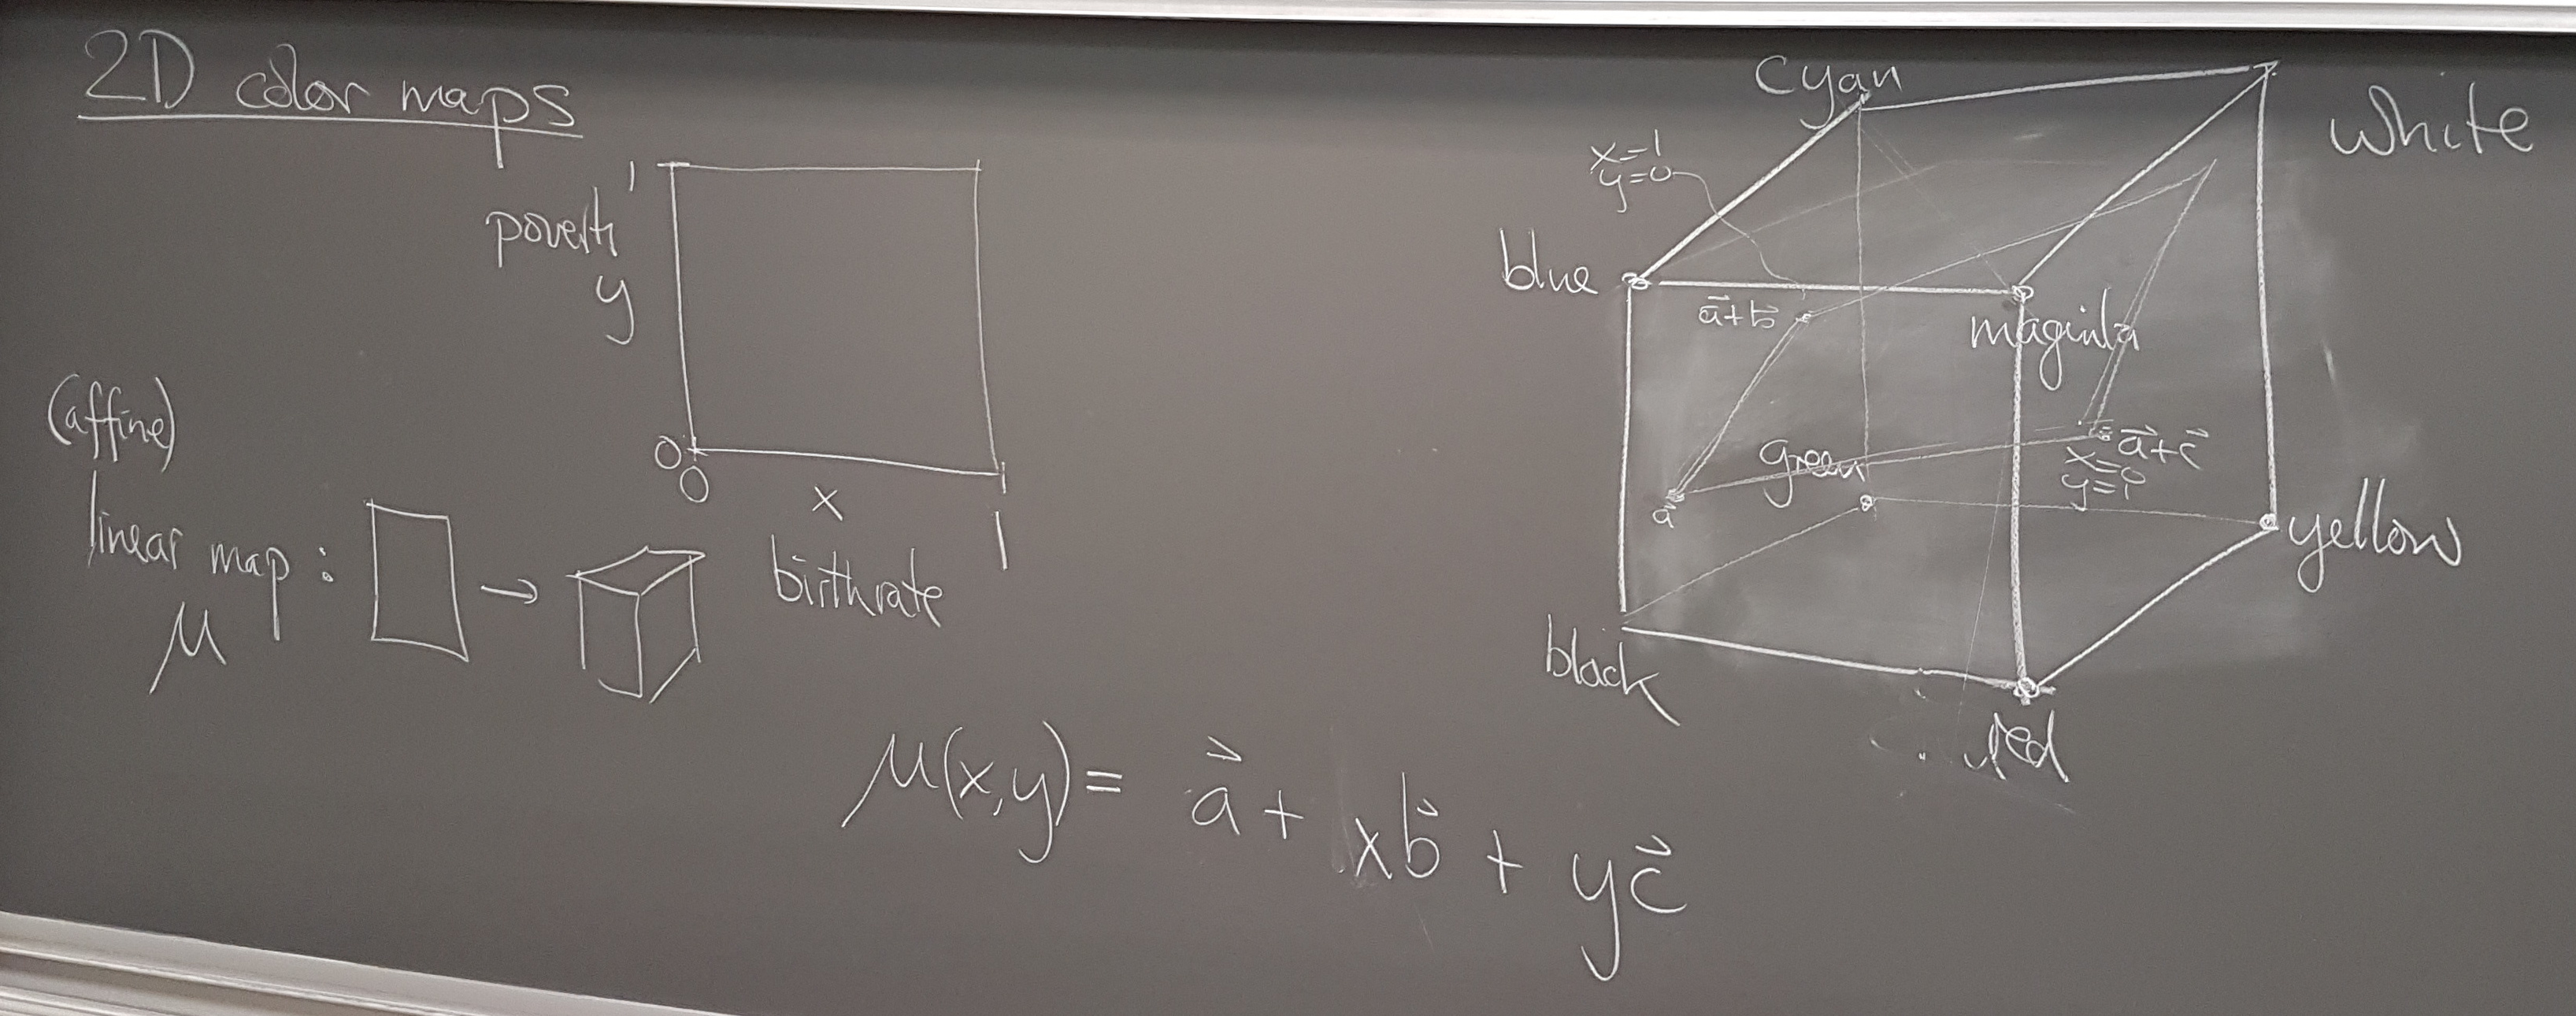
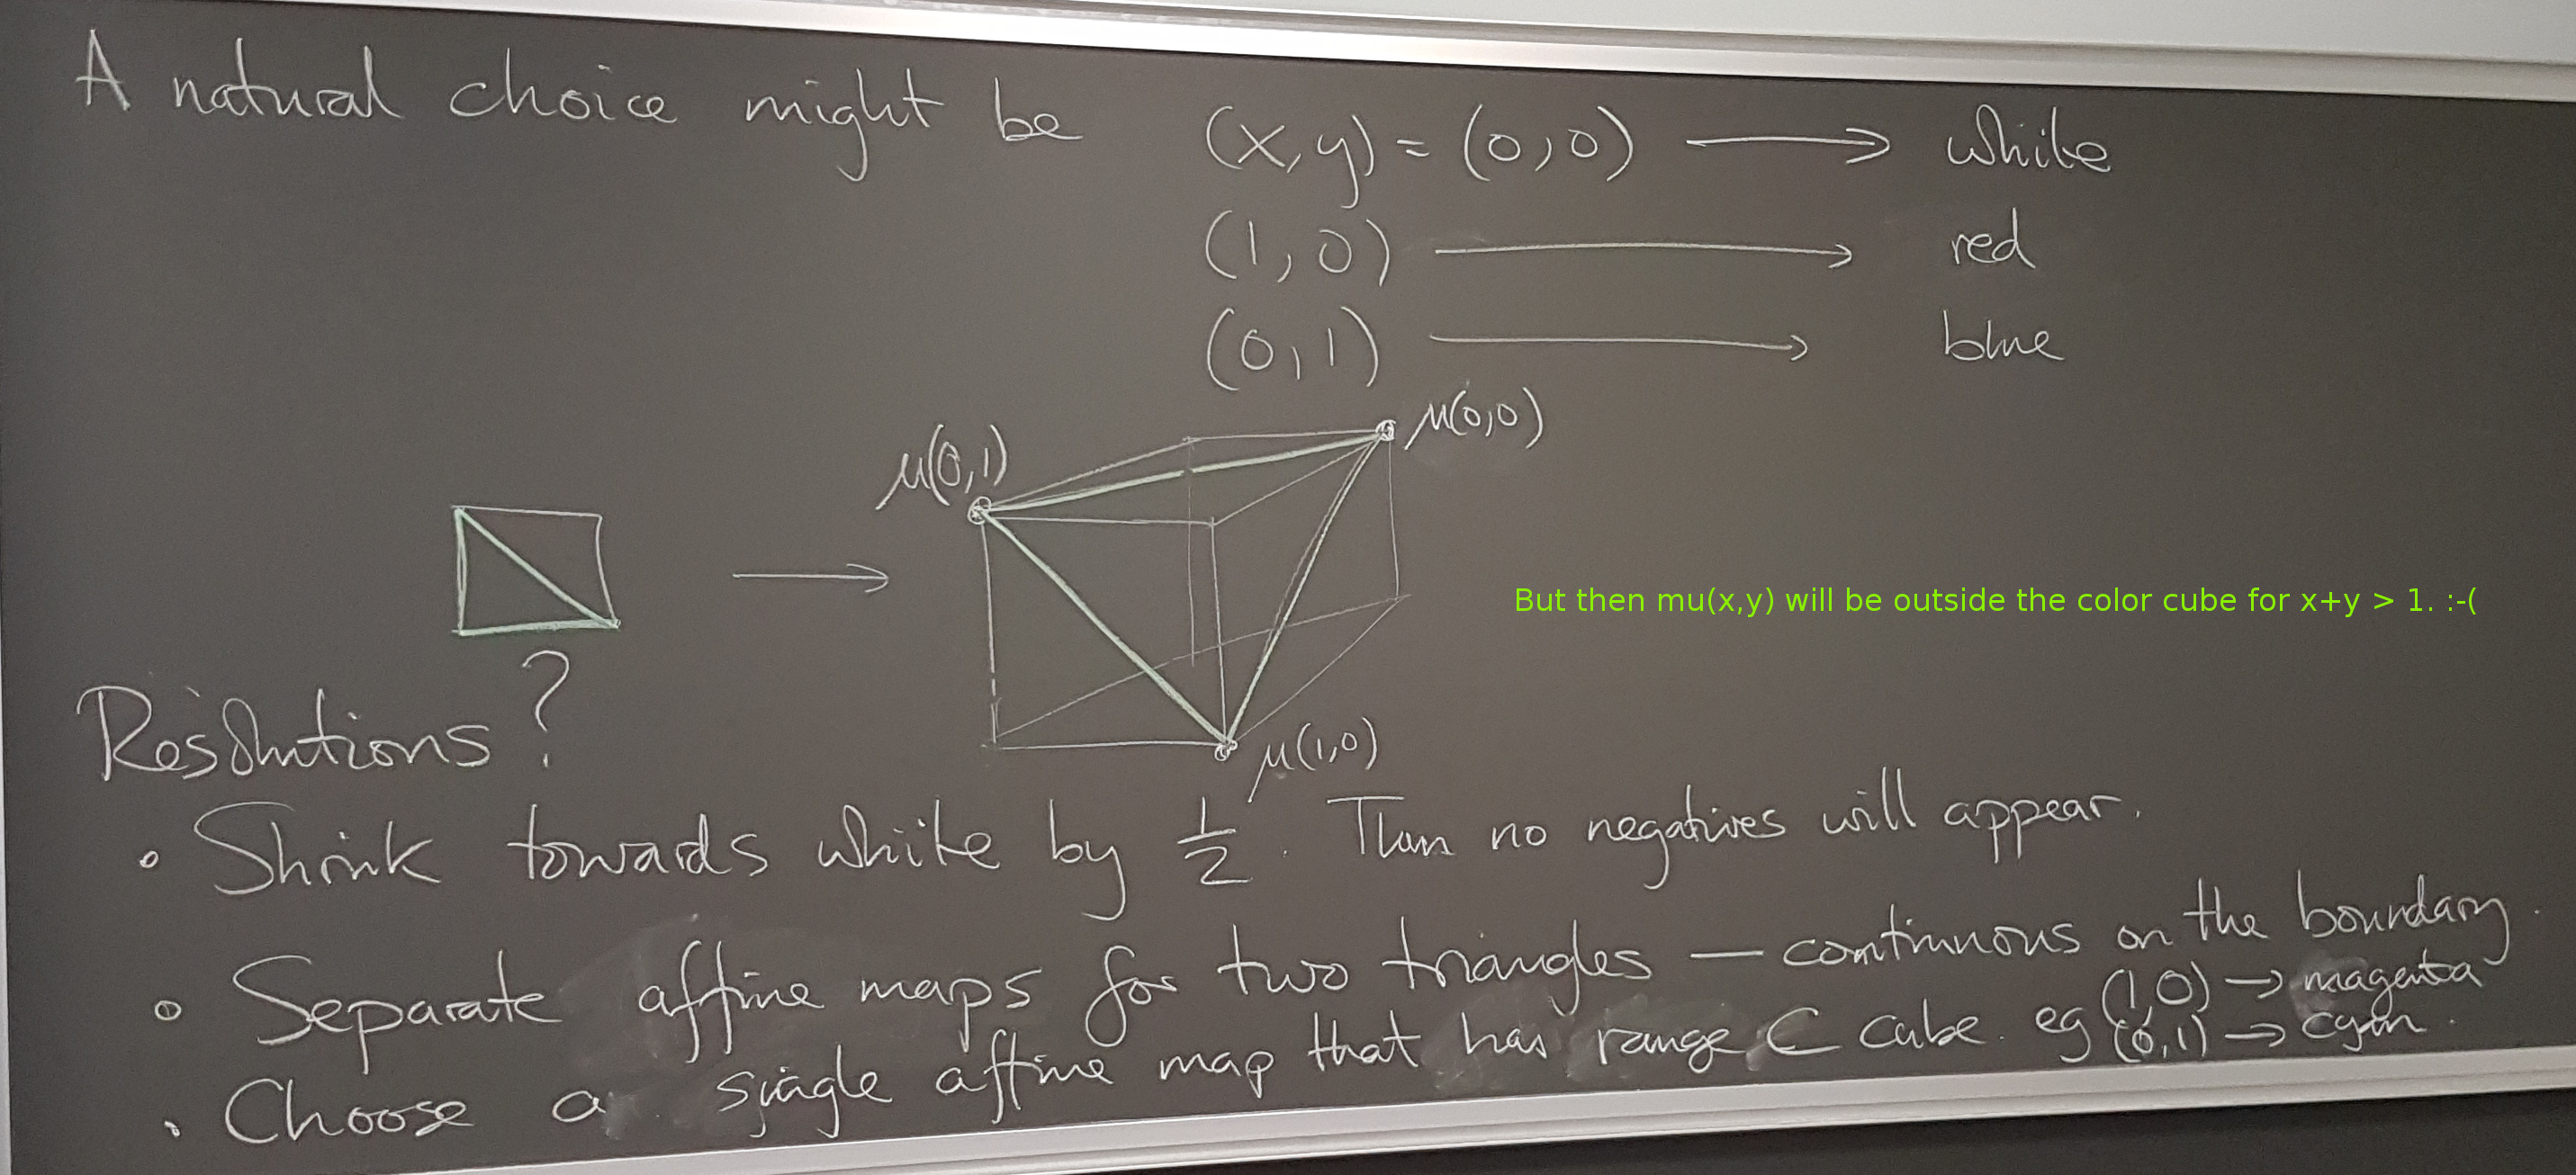
This may require some thought, some research, and some work. Although you are welcome to consider elaborate color maps (even 2D maps representing two quantities), you should beware of creating graphics that are strikingly colorful but difficult for the viewer to interpret. Simple things like a white-to-red gradient can be very effective: the picture below shows the fraction of the population that is of African descent (generated by a student in this class in 2015).
Step 1 - Automate your editing of USA.svg, saving as a new svg
Below is an example that colors erie county
# first open the NEW file
from lxml import etree
with open('USA.svg') as f:
    doc = etree.fromstring(f.read().encode('utf-8'))
# lets get to know the data structure
for i,item in enumerate(doc):
    print('-------------------------------')
    if 'style' in item.attrib:
        print(item.attrib['style'])
    if i > 6: break
# now lets include an if statement selecting Erie, NY
for i,item in enumerate(doc):
    if 'style' in item.attrib:
        if item.attrib['id'] =='36029': #this is the id for Erie, NY
            print(item.attrib)
# now lets modify the map, color Erie, and save a new svg
for i,item in enumerate(doc):
    if 'style' in item.attrib:
        if item.attrib['id'] =='36029': #this is the id for Erie, NY
            item.attrib['style'] = item.attrib['style'].replace('fill:#d0d0d0','fill:'+'#6f62fa')

with open('erie_map.svg','w') as f:
    f.write(etree.tostring(doc).decode('utf-8'))
Now lets color all cells a random color
# first we define a random color generator
from numpy import *
def foo(x): return hex( min(255,int(x*256)) )[2:].zfill(2)
def goo(r,g,b): return '#'+foo(r)+foo(g)+foo(b)
def randomcolor(pallor=0):
    c = random.rand(3)
    d = (1-pallor)*c + pallor*(ones(3))
    return goo(*d)
# reopen original svg
with open('USA.svg') as f:
    doc = etree.fromstring(f.read().encode('utf-8'))

#replace all fills to a random color
for i,item in enumerate(doc):
    #print('-------------------------------')
    if 'style' in item.attrib:
        item.attrib['style'] = item.attrib['style'].replace('fill:#d0d0d0','fill:'+randomcolor(.1))
with open('randomcoloredmap.svg','w') as f:
    f.write(etree.tostring(doc).decode('utf-8'))
Do NOT use choropleths for "extensive" quantities
For example, not appropriate for tons of CO2 emitted or for total sales, etc.
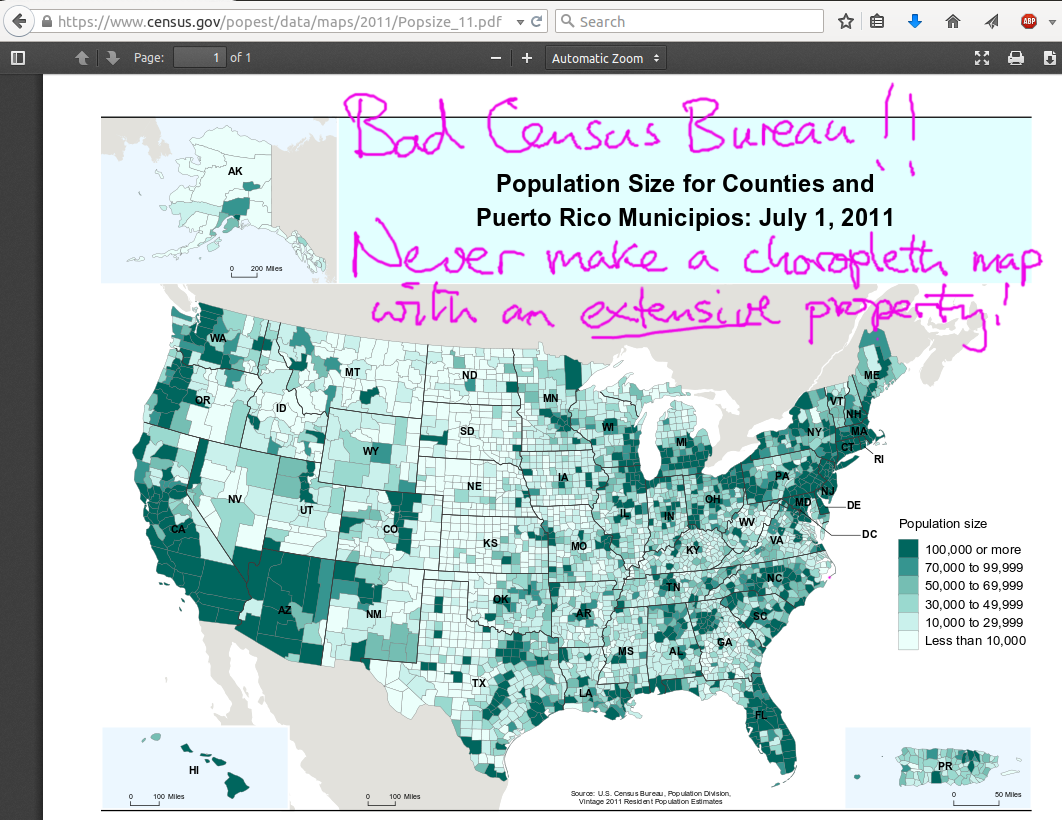
Use only for "intensive" properties, like densities, percentages, etc.: people per square km, tonnes of CO2 emitted per 1000 persons or per sq km
Key question to ask yourself: If two (neighboring) counties decided to merge (or if one county split into two) would the picture change in a sensible way?
For future reference, if you do want to represent an extensive quantity, possible options (for another report) are:
disks (or other objects) whose are is proportional to the represented quantity:
or a "cartogram" in which areas are distorted so as to be proportional to the represented quantity:
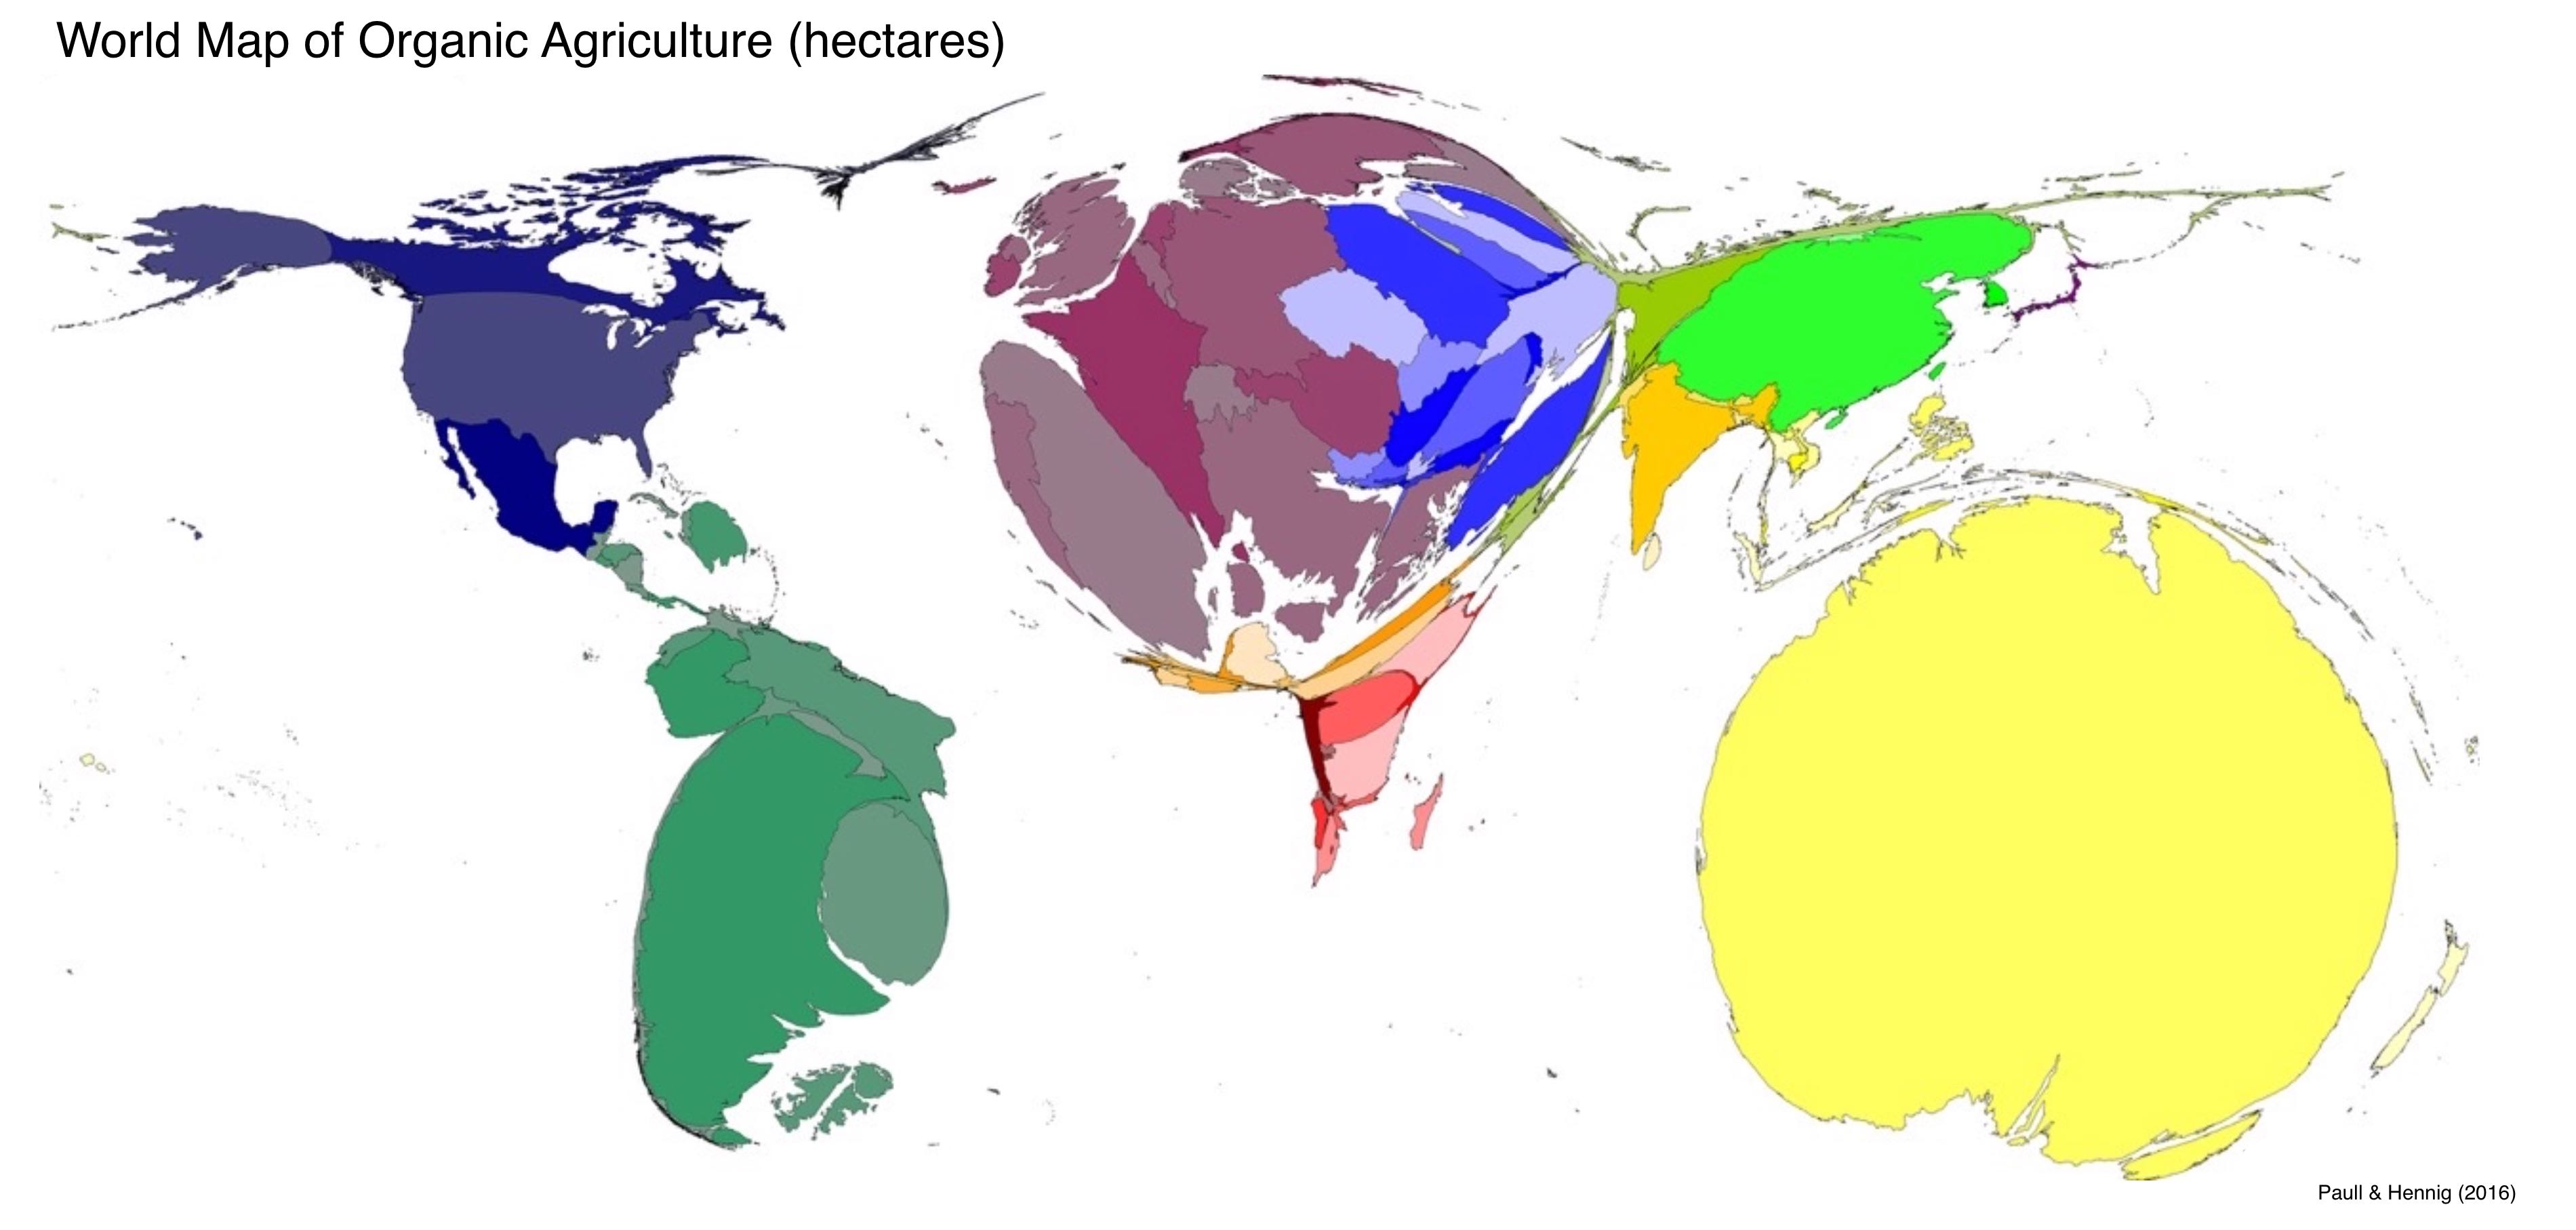
But for this report, you will be making a choropleth map of an intensive quantity.
Do not use black as a choropleth background color
unless black is your page color. It is hard on the reader's eyes to have a picture with a black background embedded in a white page.
Make the most revealing combinations/comparisons of data
To show correlation (or not) instead of a 2D color map with redness for poverty and blueness for birthrate, consider using color as a function of the (log?) ratio.
Avoid code repetition
Repeating makes your code (i) difficult to maintain reliably, (ii) difficult and time-consuming for others to read and understand, and (ii) bigger than it has to be.
Instead of this:
      for item in doc:
          if item.attrib['id'].isdigit():
              if item.attrib['id'] in Ancestry:
                      s = 'font-size:12px;fill:'
                      s += myf(float(Ancestry[item.attrib['id']][0]))
                      s += ';fill-rule:nonzero;stroke:#000000;stroke-opacity:1;stroke-width:0.1;stroke-miterlimit:4;stroke-dasharray:none;stroke-linecap:butt;marker-start:none;stroke-linejoin:bevel'
                      item.attrib['style']= s
      news= etree.tostring(doc)
      o=open('reportedanc.svg', 'w')
      o.write(news)
      o.close()

      # American Roots
      for item in doc:
          if item.attrib['id'].isdigit():
              if item.attrib['id'] in Ancestry:
                      s = 'font-size:12px;fill:'
                      s += myf(float(Ancestry[item.attrib['id']][1]))
                      s += ';fill-rule:nonzero;stroke:#000000;stroke-opacity:1;stroke-width:0.1;stroke-miterlimit:4;stroke-dasharray:none;stroke-linecap:butt;marker-start:none;stroke-linejoin:bevel'
                      item.attrib['style']= s
      news= etree.tostring(doc)
      o=open('American.svg', 'w')
      o.write(news)
      o.close()

      # Arab Roots
      for item in doc:
          if item.attrib['id'].isdigit():
              if item.attrib['id'] in Ancestry:
                      s = 'font-size:12px;fill:'
                      s += myf(float(Ancestry[item.attrib['id']][2]))
                      s += ';fill-rule:nonzero;stroke:#000000;stroke-opacity:1;stroke-width:0.1;stroke-miterlimit:4;stroke-dasharray:none;stroke-linecap:butt;marker-start:none;stroke-linejoin:bevel'
                      item.attrib['style']= s
      news= etree.tostring(doc)
      o=open('Arab.svg', 'w')
      o.write(news)
      o.close()

      # West Europe Roots
      for item in doc:
          if item.attrib['id'].isdigit():
              if item.attrib['id'] in Ancestry:
                      s = 'font-size:12px;fill:'
                      s += myf(float(Ancestry[item.attrib['id']][3]))
                      s += ';fill-rule:nonzero;stroke:#000000;stroke-opacity:1;stroke-width:0.1;stroke-miterlimit:4;stroke-dasharray:none;stroke-linecap:butt;marker-start:none;stroke-linejoin:bevel'
                      item.attrib['style']= s
      news= etree.tostring(doc)
      o=open('WesternEurope.svg', 'w')
      o.write(news)
      o.close()

      #Eastern Europe Roots
      for item in doc:
          if item.attrib['id'].isdigit():
              if item.attrib['id'] in Ancestry:
                      s = 'font-size:12px;fill:'
                      s += myf(float(Ancestry[item.attrib['id']][4]))
                      s += ';fill-rule:nonzero;stroke:#000000;stroke-opacity:1;stroke-width:0.1;stroke-miterlimit:4;stroke-dasharray:none;stroke-linecap:butt;marker-start:none;stroke-linejoin:bevel'
                      item.attrib['style']= s
      news= etree.tostring(doc)
      o=open('Eastern Europe.svg', 'w')
      o.write(news)
      o.close()

      # French Canadian Roots
      for item in doc:
          if item.attrib['id'].isdigit():
              if item.attrib['id'] in Ancestry:
                      s = 'font-size:12px;fill:'
                      s += myf(float(Ancestry[item.attrib['id']][5]))
                      s += ';fill-rule:nonzero;stroke:#000000;stroke-opacity:1;stroke-width:0.1;stroke-miterlimit:4;stroke-dasharray:none;stroke-linecap:butt;marker-start:none;stroke-linejoin:bevel'
                      item.attrib['style']= s
      news= etree.tostring(doc)
      o=open('FrenchCanadian.svg', 'w')
      o.write(news)
      o.close()

      # High School or Higher
      for item in doc:
          if item.attrib['id'].isdigit():
              if item.attrib['id'] in Education:
                      s = 'font-size:12px;fill:'
                      s += myf(float(Education[item.attrib['id']][0]))
                      s += ';fill-rule:nonzero;stroke:#000000;stroke-opacity:1;stroke-width:0.1;stroke-miterlimit:4;stroke-dasharray:none;stroke-linecap:butt;marker-start:none;stroke-linejoin:bevel'
                      item.attrib['style']= s
      news= etree.tostring(doc)
      o=open('HS.svg', 'w')
      o.write(news)
      o.close()

      # Bachelors or Higher
      for item in doc:
          if item.attrib['id'].isdigit():
              if item.attrib['id'] in Education:
                      s = 'font-size:12px;fill:'
                      s += myf(float(Education[item.attrib['id']][1]))
                      s += ';fill-rule:nonzero;stroke:#000000;stroke-opacity:1;stroke-width:0.1;stroke-miterlimit:4;stroke-dasharray:none;stroke-linecap:butt;marker-start:none;stroke-linejoin:bevel'
                      item.attrib['style']= s
news= etree.tostring(doc)
      o=open('College.svg', 'w')
      o.write(news)
      o.close()
write this:
def foo(thing, i, filename):
      for item in doc:
               if item.attrib['id'].isdigit():
                   if item.attrib['id'] in thing:
                           s = 'font-size:12px;fill:'
                           s += myf(float(thing[item.attrib['id']][i]))
                           s += ';fill-rule:nonzero;stroke:#000000;stroke-opacity:1;stroke-width:0.1;stroke-miterlimit:4;stroke-dasharray:none;stroke-linecap:butt;marker-start:none;stroke-linejoin:bevel'
                           item.attrib['style']= s
      news= etree.tostring(doc)
      o=open(filename, 'w')
      o.write(news)
      o.close()

foo(Ancestry ,0,   'reportedanc.svg')
foo(Ancestry ,1,      'American.svg')
foo(Ancestry ,2,          'Arab.svg')
foo(Ancestry ,3, 'WesternEurope.svg')
foo(Ancestry ,4,'Eastern Europe.svg')
foo(Ancestry ,5,'FrenchCanadian.svg')

foo(Education,0,'HS.svg')
foo(Education,1,'College.svg')
Likewise, never have two instances of a number that are always supposed to be the same: give it a name and use the name in the multiple places:
DO NOT DO THIS:
from numpy import *
a = zeros((99,99))
# ...
b = zeros(99)
DO THIS
n=99
a = zeros((n,n))
# ...
b = zeros(n)
Color bars
We need these for maps to be quantitative!!!
Once in a while, point-and-click is the way to go!
Other way: edit SVG blank map with Inkscape to insert a (blank) color bar for subsequent modification by our Python code: